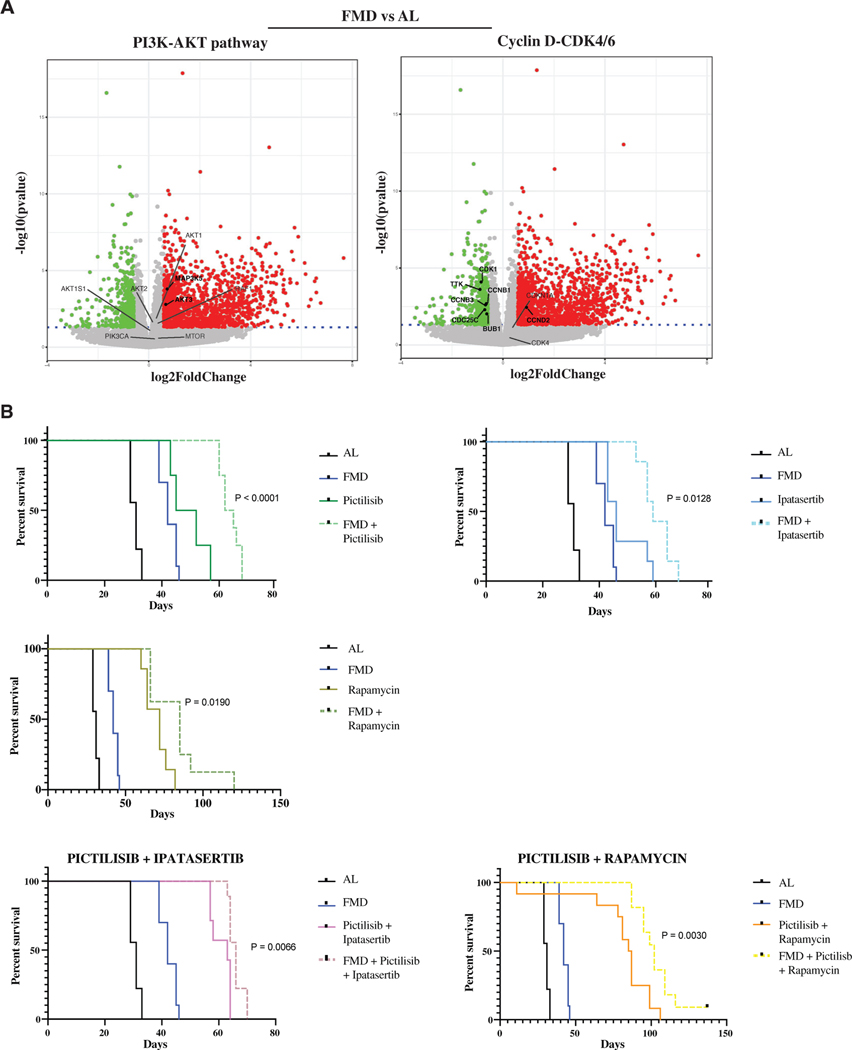
Figure 6. FMD activates starvation escape mechanisms that can be targeted by drugs.
(A) Volcano plot showing the significance versus the log2 fold change in SUM159 tumor masses, by comparing FMD versus AL. Up- and downregulated genes (|log2FC| > 0.58 and adj. p < 0.05) are displayed in red and green, respectively. Deregulated genes involved in PI3K-AKT-mTOR and CycD-CDK4/6 pathways are highlighted. Significantly deregulated genes are reported in bold.
(B) Growth of SUM159 xenografts in 8-week-old female NOD scid (NSG) mice treated with AL diet or FMD, alone or combined with pictilisib (100 mg/kg, 5 consecutive days a week by oral gavage), ipatasertib (75 mg/kg, 5 consecutive days a week by oral gavage), or rapamycin (2 mg/kg, every other day i.p.), as single or double treatments (n = 8–12). Survival curves are reported.
p values were determined by log-rank (Mantel-Cox) test (B). See also Figure S6.

