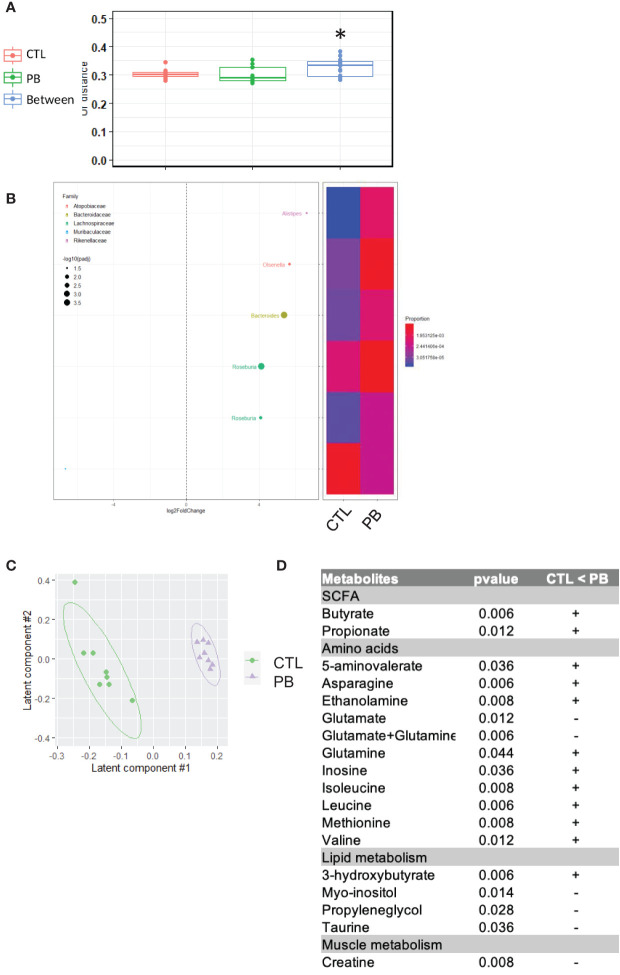
Figure 3.
Offspring from prebiotics- and control-supplemented dams have different microbiota at 6 weeks of age. (A) β-Diversity as measured by UniFrac distances from control (CTL) or prebiotic (PB) pups based on 16S rRNA gene sequencing at 6 weeks of age. Within- and between-group dissimilarities were tested by permutational multivariate ANOVA (PERMANOVA) (*p < 0.05; n = 20 per group). (B, left figure) Graphic representation of differentially abundant Operational Taxonomic Units (OTUs) (FC > I2I; adjusted posttest p-value <0.05) between CTL and PB pups at 6 weeks of age. Each OTU is colored according to its taxonomic classification at the family level. Taxonomy at the genus or species level is also indicated, when available, next to each OTU. Log2FoldChange (FC) is plotted on the x-axis. The diameter of the circle drawn for each OTU is related to the value of the adjusted posttest p-value. (B, right figure) Heatmap representing the relative abundance of differentially abundant OTUs in pups at 6 weeks of age in stools of dams fed the CTL or PB diet. (C) Two-dimensional partial least squares discriminant analysis (PLS-DA) score plot of OSC-filtered and Pareto-scaled 1H NMR integrated spectra of colon samples (green circle: control, n = 8; purple triangle: supplementation, n = 8). (D) Table of discriminant metabolites measured in colon between CTL and PB pups.

