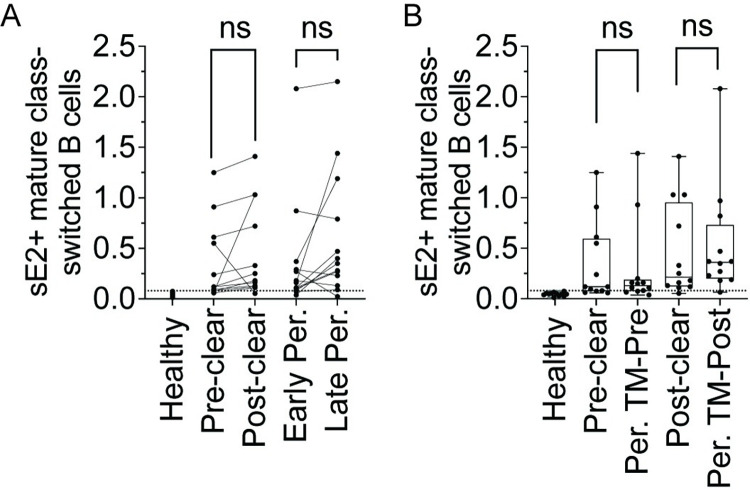
Fig 2. Equivalent frequencies of sE2-specific B cells in Clearance or Persistence subjects.
(A) Frequency (%) of class switched B cells that are sE2-specific (sE2+ csBC; CD3-, CD19+, IgM-, IgD-, CD10-, sE2+) at two timepoints from 12 Clearance or 13 Persistence subjects. Lines link samples from the same subject. (B) Comparison of % sE2+ csBC between Clearance subjects (pre-Clear, post-Clear) or Persistence subjects time-matched with pre- or post-Clearance samples for duration of infection (Per. TM-Pre, Per. TM-Post). Dotted line represents the true-positive threshold, defined as the mean frequency plus two standard deviations in the healthy group. Each point indicates a single sample. In B, Horizontal lines indicate means, boxes are inter-quartile range, and whiskers are minimum to maximum. Normality of data was determined using Shapiro Wilk normality test. Comparisons in A were performed using paired two-tailed Student’s T test and in B, using unpaired Mann-Whitney U test with p values adjusted using the Bonferroni method. ns = not significant.

