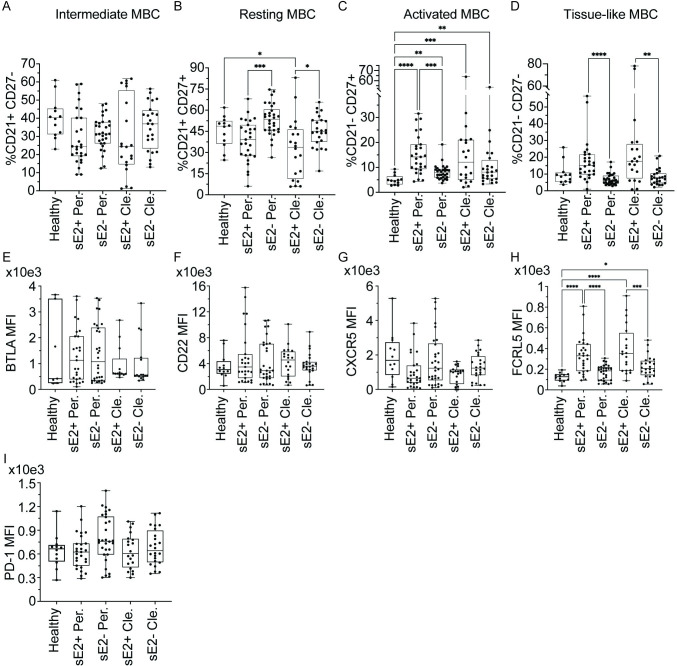
Fig 3. Expansion of actMBC and tlMBC, with upregulation of FCRL5 expression on sE2+ csBC.
For A-D, frequency (%) of (A) intermediate MBC (intMBC, CD21high, CD27low), (B) resting MBC (rMBC, CD21high, CD27high), (C) activated MBC (actMBC, CD21low, CD27high), or (D) tissue-like memory B cells (tlMBC, CD21low, CD27low) subsets. For E-I, geometric mean fluorescence intensity (MFI) of (E) BTLA, (F) CD22, (G) FCRL5, (H) CXCR5, or (I) PD-1. Samples compared are sE2-nonspecific (sE2-) or sE2-specific (sE2+) csBC from healthy, Persistence (Per.), or Clearance (Cle.) subjects, with each point indicating a single sample. Early Persistence, late Persistence, pre-Clearance, and post-Clearance samples are included. Horizontal lines indicate means, boxes are inter-quartile range, and whiskers are minimum to maximum. Normality of data was determined using the Shapiro Wilk normality test. Comparisons were performed using the Kruskal-Wallis test for non-normally distributed data (A, C-D, E-F, H) or one-way ANOVA for normally distributed data (B, G, I), with p values adjusted for multiple comparisons using the Benjamini, Krieger and Yekutieli method. Only statistically significant comparisons are indicated (* P ≤ 0.05, ** P ≤ 0.01, *** P ≤ 0.001, **** P ≤ 0.0001).

