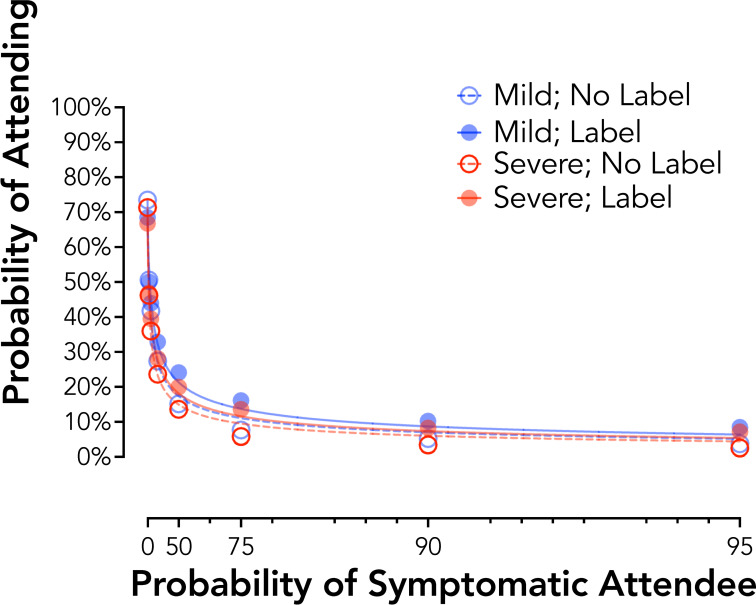
Fig 1. Probability discounting of social event attendance by symptom framing (Experiment 1).
Plotted are group discounting curves by severity (mild = blue circles; severe = red circles) and label type (no label = open circles, dotted line; label = closed circles, solid line). X axis values are analyzed as odds in favor of a symptomatic attendee. Curves are plotted using the hyperbolic discounting equation including a non-linear scaling parameter [43].

