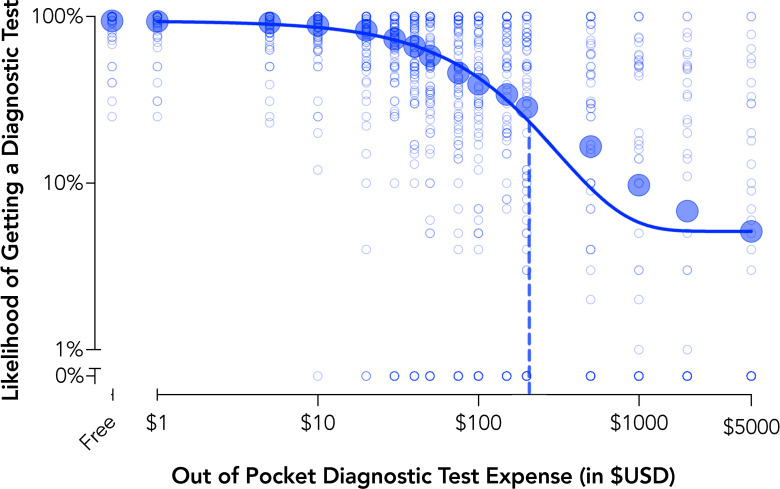
Fig 4. Behavioral economic demand for diagnostic testing (Experiment 4).
Plotted are group mean data and individual data points for behavioral economic demand of diagnostic testing recorded on the hypothetical purchase task. Demand curve data are plotted using the exponential demand function [54]. The dotted line is the price representing shifts from inelastic or price insensitive to elasticity or price sensitive demand (Pmax).

