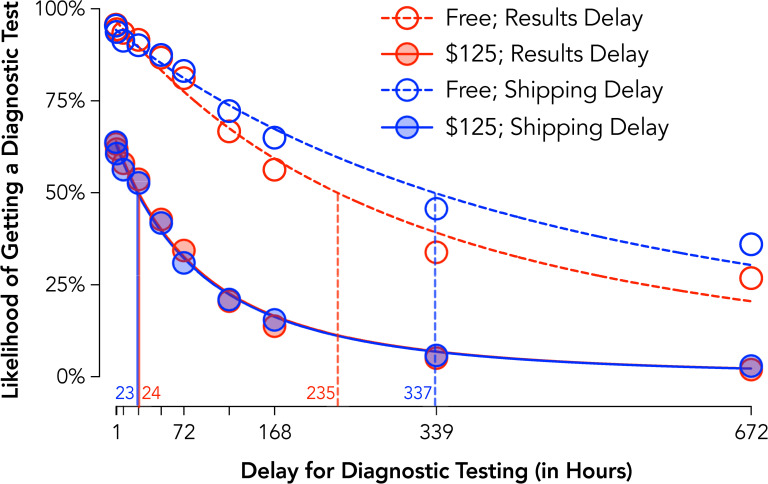
Fig 5. Delay discounting of COVID-19 diagnostic testing by delay type and cost (Experiment 5).
Plotted are group discounting curves by delay type (delay to receiving a test with immediate feedback = red circles; delay to receiving results from an immediate test = blue circles) and cost (Free = open circles, dotted lines; $125; closed circles, solid lines). Curves are plotted using the hyperbolic discounting equation including a non-linear scaling parameter [43]. Vertical lines are estimated ED50 or the delay at which half of the population is likely to procure a test.

