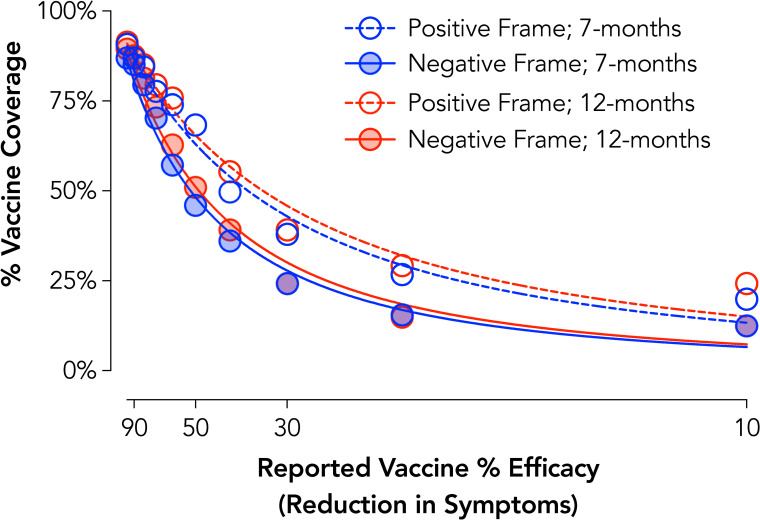
Fig 7. COVID-19 vaccine acceptance by development timeline and safety framing.
Plotted are group discounting curves by developmental timeline (7-months = blue; 12-months = red) and safety framing (positive = open circles/dotted lines; negative = full circles/lines). X axis values are computed as odds against symptom reduction. Curves are plotted using the hyperbolic discounting equation including a non-linear scaling parameter [43].

