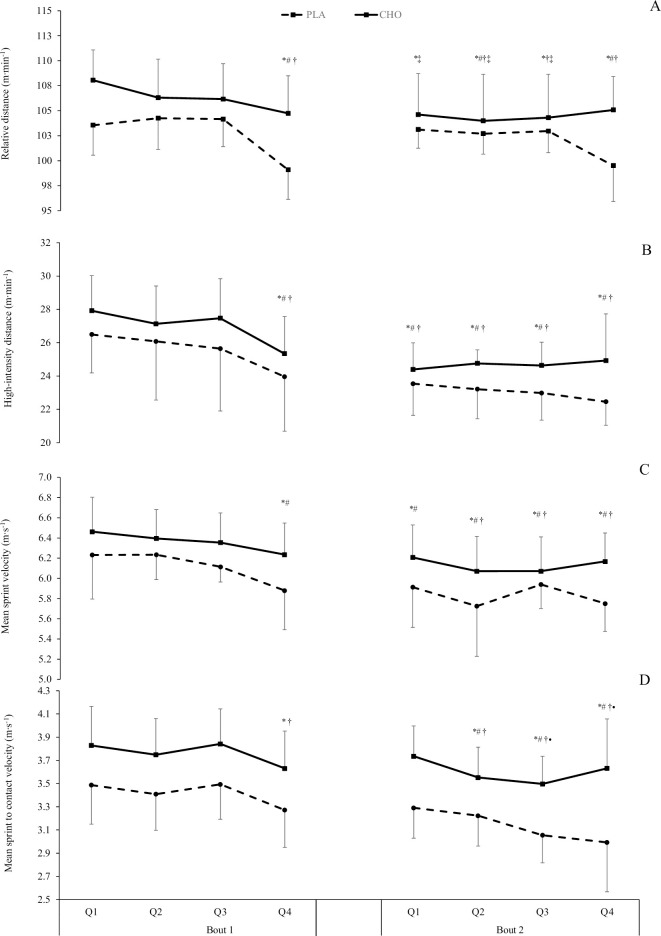
Fig 3.
Mean (± SD) relative distance (A), high-intensity distance (B), sprint velocity © and sprint to contact velocity (D) with CHO (solid line) and placebo (dashed line) at each quarter of the RLMSP-i. *, #, †, ‡ and • indicate a time-effect compared to Q1, Q2, Q3, Q4 of the first half and Q1 second half, respectively.

