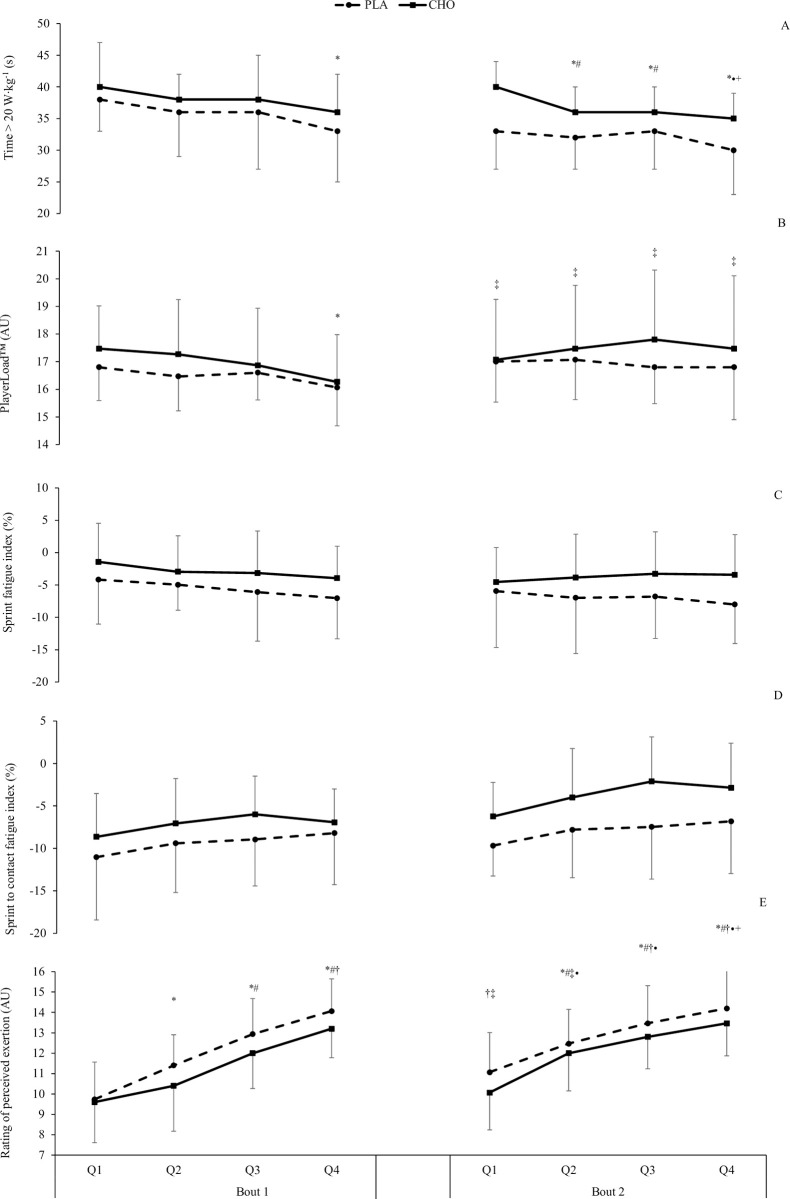
Fig 4.
Mean (± SD) HMP time (A), PlayerLoadTM (B), sprint fatigue index (C), sprint to contact fatigue index (D) and rating of perceived exertion (E) with CHO (solid line) and placebo (dashed line) at each quarter of the RLMSP-i. *, #, †, ‡ indicate significant difference compared to Q1, Q2, Q3 and Q4 of the first half respectively. • and + indicate a significant difference compared to Q1 and Q3 of the second half, respectively.

