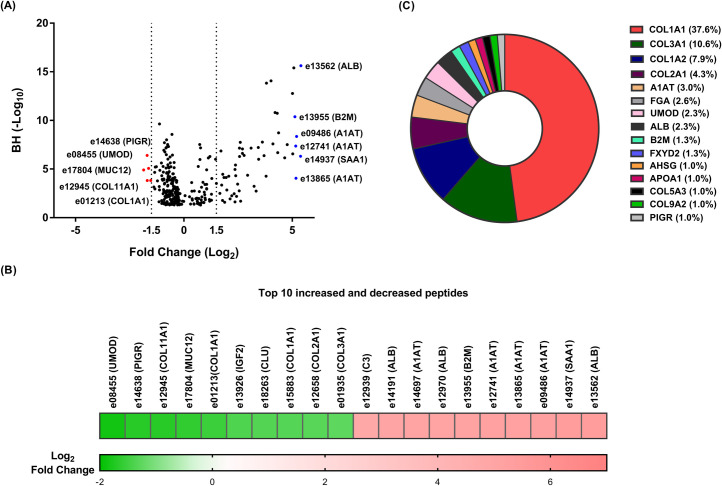
Fig 1. Urinary peptides in CKD.
(A) Volcano plot showing the fold change (log2 CKD/non-CKD) plotted against the BH p-value (-log10) of the 303 differentially excreted CKD-associated peptides. The top five most increased and decreased abundance peptides in CKD patients are highlighted in blue (for increased) and red (for decreased) colours. (B) Heatmap of the log2 transformed fold change of the top 10 most increased and decreased peptides in CKD patients. In each case, the peptide codes are provided in the S1 Table. (C) Pie chart of the top 15 most frequently observed protein precursors, that covered 76% (n = 230) of differentially excreted CKD-associated peptides. The percentage of the differentially excreted peptides per protein precursor is presented.

