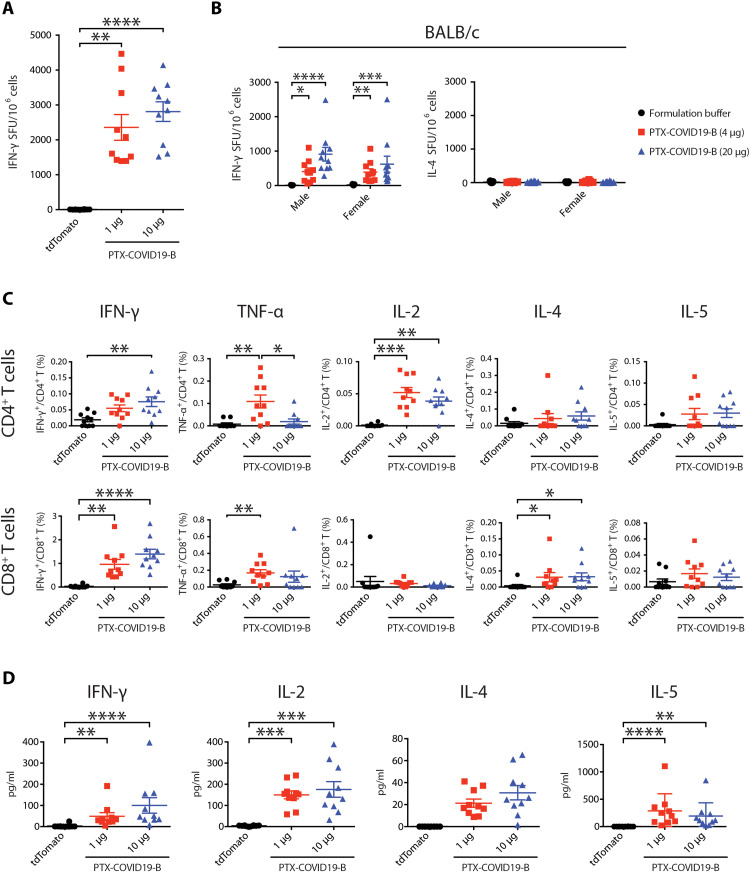
Fig. 4. PTX-COVID19-B elicits robust cellular immune responses in mice.
(A, C, and D) Female C57BL/6 mice were vaccinated with 1- or 10-μg doses of PTX-COVID19-B or 10 μg of tdTomato mRNA. (B) Male and female BALB/C mice were vaccinated with 4- or 20-μg doses of PTX-COVID19-B or formulation buffer as a control. Three weeks after the second vaccination, spleens were collected and the splenocytes were stimulated with SARS-CoV-2 S peptide pool to detect cytokine production, as measured by ELISPOT shown in (A) and (B), intracellular cytokine staining and flow cytometry shown in (C), and a multiplex immunoassay shown in (D). Shown in (A) are the numbers of IFN-γ spot-forming units (SFU) per million splenocytes (n = 10 per group), (B) the numbers of IFN-γ and IL-4 spot-forming units per million splenocytes (n = 9 for each of the formulation groups and n = 10 for each of the PTX-COVID19-B groups), (C) percentage of cytokine-producing cells in CD4+ or CD8+ T cells (n = 10 per group), and (D) quantity of the cytokines in the supernatants of the stimulated splenocytes (n = 10 per group). Each symbol represents one mouse. For each group, the long horizontal line indicates the mean, and the short lines below and above the mean indicate the SEM. *P < 0.05, **P < 0.01, ***P < 0.001, and ****P < 0.0001 as determined by one-way ANOVA (Kruskal-Wallis test) followed by Dunn’s multiple comparison test.

