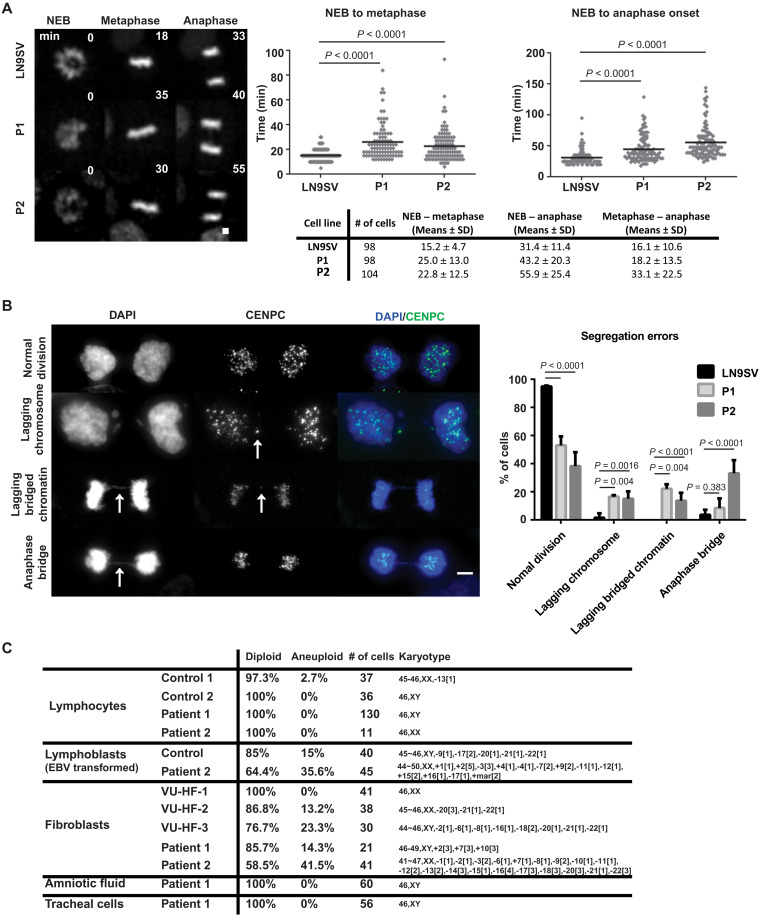
Fig. 2. BUB1 patient cells display impaired mitotic fidelity.
(A) Cells were filmed as they progressed through mitosis and the time from NEB until metaphase alignment (left) or anaphase onset (right) measured, as summarized in the table. Representative images are shown, with the time after NEB indicated (minutes). Cells from at least three independent experiments were analyzed. (B) Chromosome segregation errors were quantified in unsynchronized cells. Images depict examples of each category scored: lagging chromosomes, lagging bridged chromatin (DNA bridge with centromere staining), and anaphase bridges (defined when no centromere staining was visible within the DNA bridge). Category differences are highlighted by white arrows. A total of 65 (LN9SV), 73 (P1), or 63 (P2) late-mitosis cells were analyzed, derived from at least three independent experiments. (C) Cytogenetic analysis of nontransformed lymphocytes, Epstein-Barr virus (EBV)–transformed lymphoblast cell lines, primary fibroblast cell lines, amniotic fluid, and tracheal cells obtained from P1, P2, and unrelated controls. Scale bars, 5 μm. Presented P values were calculated using a Kruskal-Wallis test.

