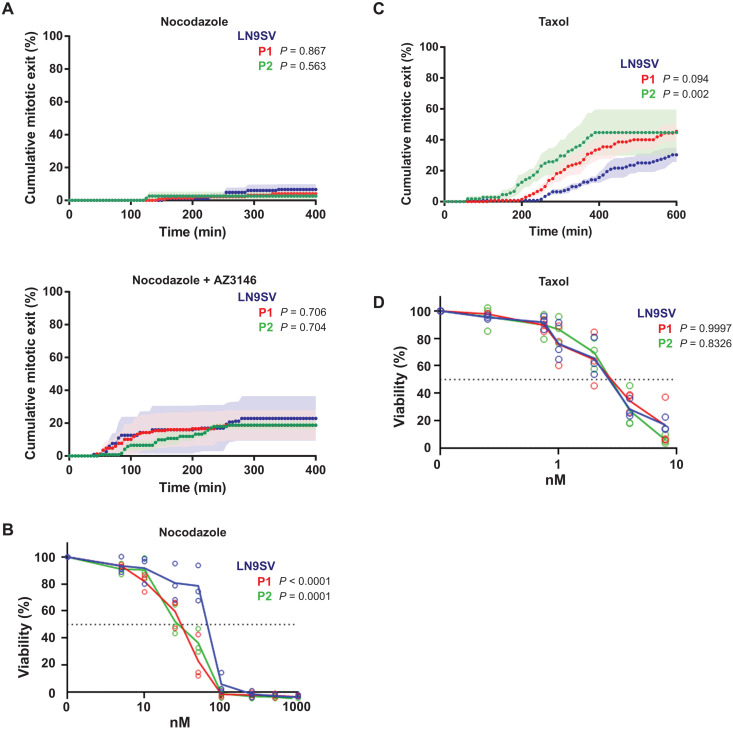
Fig. 3. BUB1 patients’ cells have a functional SAC.
(A) Cumulative mitotic exit of cells treated with 3.3 μM nocodazole (top; LN9SV n = 121, P1 n = 112, and P2 n = 65 cells) or 3.3 μM nocodazole combined with 3 μM AZ3146 (bottom; LN9SV n = 112, P1 n = 105, and P2 n = 107). Mitotic progression was filmed for 6 hours. Shown are means (dotted line) ± SEM (solid shading in a lighter color) from at least three independent experiments. (B) Cells were continuously exposed to increasing concentrations of nocodazole. After three population doublings of untreated cells, cells were counted and plotted as a percentage of untreated cells. Mean and individual data points from three independent experiments are shown. (C) Cumulative exit was quantified in cells treated with 20 nM Taxol and imaged for 12 hours. LN9SV n = 102, P1 n = 99, and P2 n = 70 cells from three experiments for each condition. Mean values are shown, and SEM is represented as solid shading in a lighter color of each corresponding condition. (D) Cells were continuously exposed to increasing concentrations of Taxol, and survival was assessed as in (B). Statistical analysis of the cumulative exit (A and C) was performed using Kaplan-Meier survival curves computed for each condition/drug combinations and assessed for statistical differences using the log-rank test. Differences in drug sensitivity (B and D) between patient cell lines and LN9SV were statistically assessed using beta regression.

