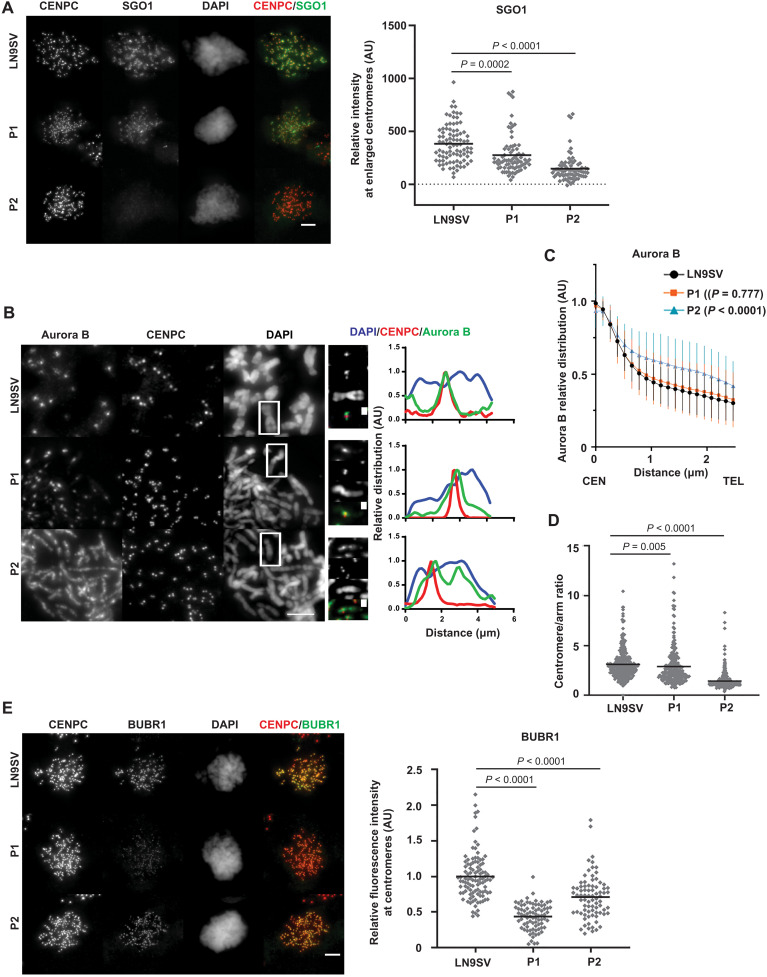
Fig. 4. Key molecular targets of BUB1 are differentially affected in patient cells.
(A) Colchicine-arrested cells were stained for CENPC and SGO1. Centromeric region was defined on the basis of CENPC staining, enlarged by 0.2 μm, and used to measure SGO1 mean intensity within that region. Each dot represents one cell, and black lines represent the mean per condition. LN9SV n = 89, P1 n = 79, and P2 n = 77 cells from three independent experiments. (B) Chromosomal spreads were stained for Aurora B and CENPC. Right panels depict relative chromosomal distribution of Aurora B, CENPC, and DAPI of the signaled chromosome. These plot profiles depict signal along chromosomal length, normalized to the maximum plot value within each set. (C) Bulk analysis of relative chromosome distribution of Aurora B along chromosomal arms (from centromere, CEN to telomere, TEL). Plot profiles were obtained as in (B), and the graph depicts the average (± SD) of approximately 100 chromosomes per condition from at least three independent experiments. P values refer to the comparison of relative intensities 1.5 μm away from the centromere. (D) Centromere/arm ratio of Aurora B signal measured from chromosomal spreads. At least 50 cells were quantified from three independent experiments. Each dot represents a chromosome. (E) Colchicine-arrested cells were stained for BUBR1 and CENPC. BUBR1 intensity within the CENPC-defined region was measured. LN9SV n = 105, P1 n = 80, and P2 n = 80 cells from three independent experiments. Each dot represents a cell, and black lines represent the mean. Each independent dataset was normalized to the average intensity of LN9SV. Scale bars, 5 μm, except on the enlarged images of the signaled chromosomes (1 μm). Presented P values were calculated using a Kruskal-Wallis test.

