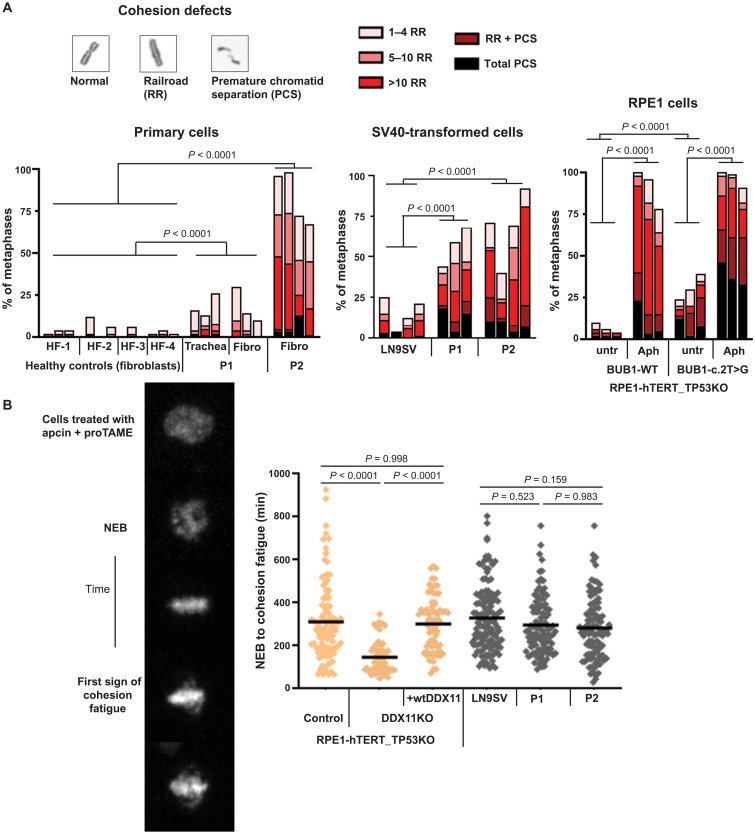
Fig. 5. Cohesion defects do not accelerate cohesion fatigue in BUB1 patient cells.
(A) Cohesion defect analysis of indicated cell lines. Per experiment, 50 metaphases were analyzed for each sample. Multiple independent experiments are shown as separate bars. Aph, aphidicolin (16 hours, 1 μM). P values were calculated using a Cochran-Mantel-Haenszel statistical test to compare the frequency of total cohesion defects per condition. (B) Cells were treated with 20 μM proTAME and 100 μM apcin, and the time from NEB to the moment at which single chromatids start escaping the metaphase plate (cohesion fatigue) was assessed by live-cell imaging. Each dot represents one cell. n ≥ 80 from at least three independent experiments. Statistical analysis was performed using one-way ANOVA.

