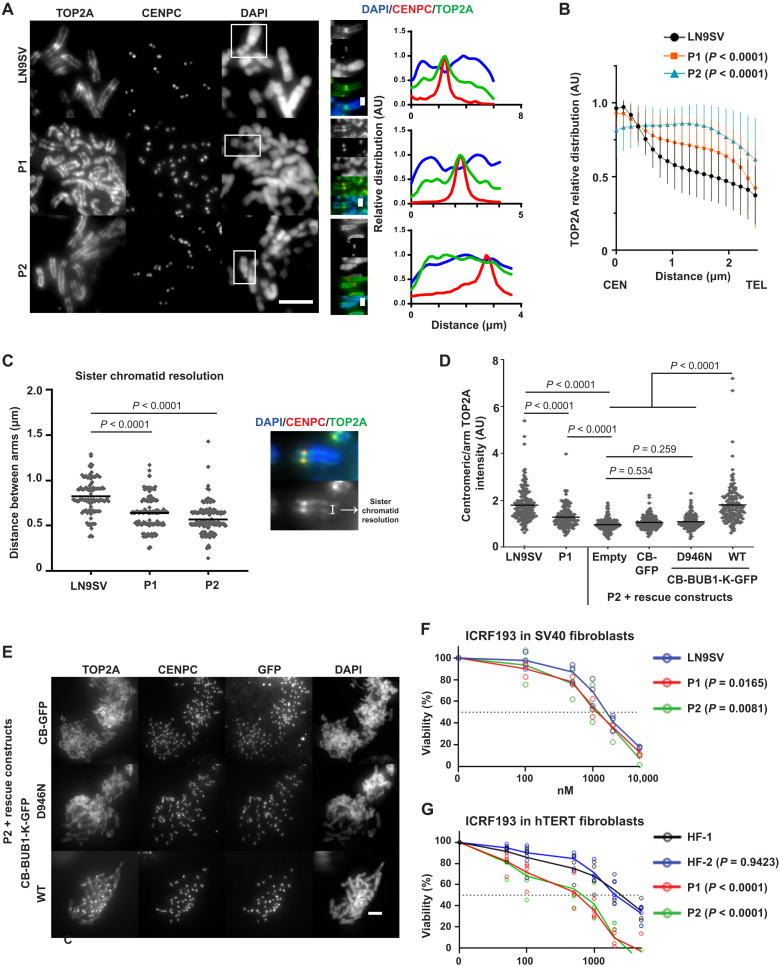
Fig. 6. BUB1 patient cells show impaired centromeric recruitment of TOP2A.
(A) Representative pictures of chromosomal spreads of P1, P2, and control cells stained for TOP2A and CENPC. Right panels depict relative chromosomal distribution of TOP2A/CENPC/DAPI of the signaled chromosome. These plot profiles depict signal along chromosomal length, normalized to the maximum plot value within each set. (B) Bulk analysis of relative chromosome distribution of TOP2A along chromosomal arms (from centromere, CEN to telomere, TEL). Plot profiles were obtained as in (A), and graph depicts average (± SD) of approximately 100 chromosomes per condition from at least three independent experiments. (C) Sister chromatid resolution in the indicated conditions, estimated from the distance between TOP2A peak signals within chromosomal arms. At least 100 chromosomes were measured per condition (~30 different cells), derived from three independent experiments. (D) Quantification of TOP2A centromere/arm ratio in chromosomal spreads, from P2 cells transfected with a centromere-targeted, GFP-tagged BUB1 kinase domain (CB-BUB1-K-GFP), a kinase-dead mutant (D946N), or an empty construct. Five chromosomes were measured per metaphase spread. At least 100 chromosomes in each condition were quantified from three independent experiments. (E) Representative pictures from (D). (F and G) Indicated cells were continuously exposed to increasing concentrations of ICRF193. After three population doublings of untreated cells, cells were counted and plotted as a percentage of untreated cells. Mean and individual data points from three (F) and four (G) independent experiments are shown. Scale bars, 5 μm, except on the enlarged images of the signaled chromosomes (1 μm). Presented P values were calculated using a Kruskal-Wallis test, except differences in drug sensitivity, which were statistically assessed using beta regression.

