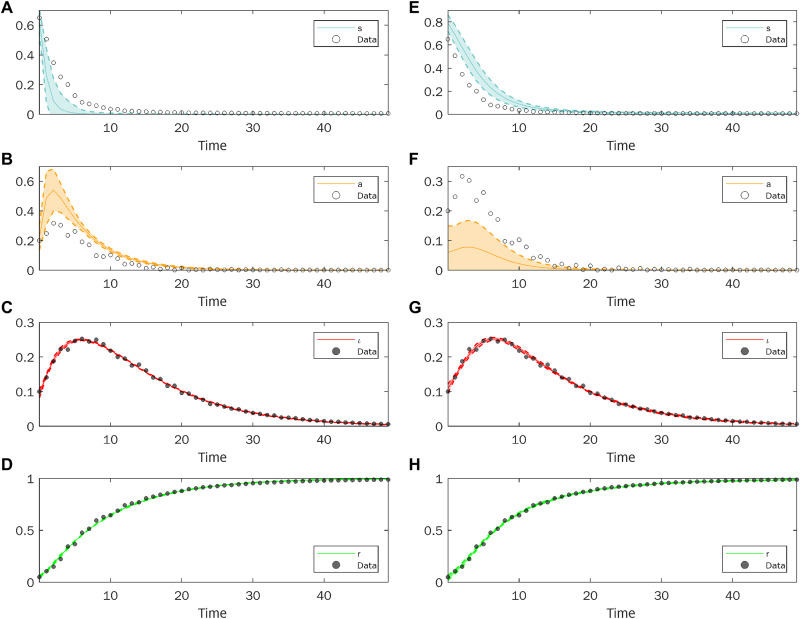
Fig. 4. Dynamics of the SIAR model when two different methods to estimate the model parameters from data are used.
(A to D) display the results obtained by a least square error minimization procedure, while (E to H) show the outcome of Bayesian inference. The time evolution of both measured and hidden variables (solid lines) is reported together with the data. Data are shown with different markers if they pertain to measured variables (full circles, used for fitting) or unmeasured ones (empty circles, not used for fitting).

