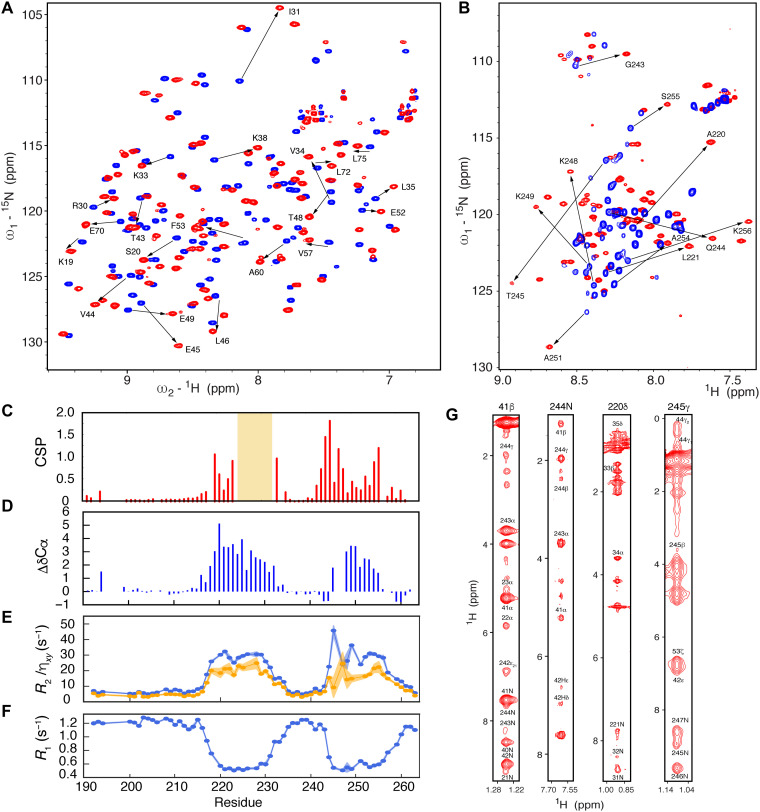
Fig. 2. NMR characterization of the sN3:sUbl1 complex.
(A) 15N-1H correlation spectra showing chemical shift perturbations (CSPs) of the sUbl1 spectrum upon binding of sN3. Exchange between free (blue) and bound (red) sUbl1 resonances is in the slow exchange regime. The spectrum shows a 1:1 complex at a concentration of 500 μM at 298 K and was measured at 850 MHz. (B) 15N-1H correlation spectra showing CSP of the sN3 spectrum upon binding of sUbl1. Exchange between free (blue) and bound (red) sN3 resonances is again in the slow exchange regime. The spectrum shows a 1:1 complex at a concentration of 500 μM at 298 K and was measured at 850 MHz. (C) 15N-1H CSP plotted as a function of sequence of sN3. Experimental conditions as in (B). Orange shading denotes the region of sN3 that could not be assigned in the free form of the protein. (D) Secondary structure propensity of sN3 in 1:1 complex with sUbl1. 13Cα chemical shifts of approximately +3.0 ppm correspond to a fully formed helix. (E and F) 15N spin relaxation of sN3 in 1:1 complex with sUbl1 (500 μM), measured at 950 MHz. Both transverse (R2, ηxy) and longitudinal (R1) relaxation identifies two rigid binding sites separated by a highly flexible linker. (G) Sample strips from 15N- and 13C-edited NOESY-HSQC experiments, showing both inter- and intramolecular cross peaks, reporting on the structure of the sUbl1-sN3 complex. All mixing times shown were between 100 and 120 ms.

