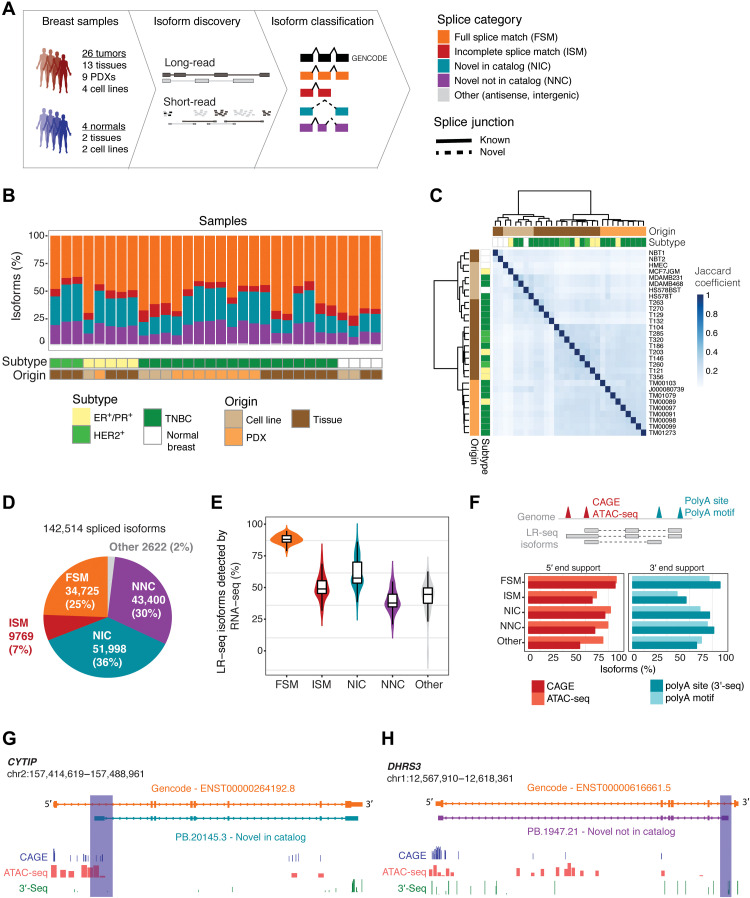
Fig. 1. LR-seq identifies previously undetected isoforms in breast cancer.
(A) Schematic of breast cancer isoform profiling by LR-seq and short-read RNA-seq. LR-seq isoforms are classified on the basis of their similarity to GENCODE isoforms using SQANTI isoform structural categories (see legend). Novel splice junctions are depicted by dashed lines and known junctions by solid lines. See also fig. S1 and file S1. (B) LR-seq isoforms detected in individual breast cancer or normal samples are colored by categories from (A), show per tissue subtype and origin. See also file S2. (C) Hierarchical clustering of samples profiled by LR-seq based on the Jaccard pairwise similarity coefficient. (D) Classification of LR-seq isoforms from merged tumor and normal samples from (B). The percent and number of distinct isoforms in each category from (A) are indicated. See also figs. S2 and S3. (E) Percent of LR-seq isoforms detected by RNA-seq in 29 breast cancer and normal samples, plotted per category from (A). (F) Percent of LR-seq isoform transcription start sites supported by CAGE (FANTOM5) or ATAC-seq (TCGA breast) peaks, transcription termination sites supported by the presence of a poly(A) motif (SQANTI2), or 3′-seq peaks from the polyA site database, plotted per category from (A). The diagram at the top exemplifies isoforms with first exons (5′ ends) validated by CAGE or ATAC-seq peaks, and terminal exons (3′ end) supported by 3′-seq peaks or poly(A) motifs. (G and H) Structure of CYTIP (G) or DHRS3 (H) previously unidentified LR-seq isoforms compared to GENCODE isoforms, along with CAGE or ATAC-seq support for unknown transcription start site (G) and 3′-seq peaks supporting the previously unknown transcription termination site (H). Novel regions are highlighted.

