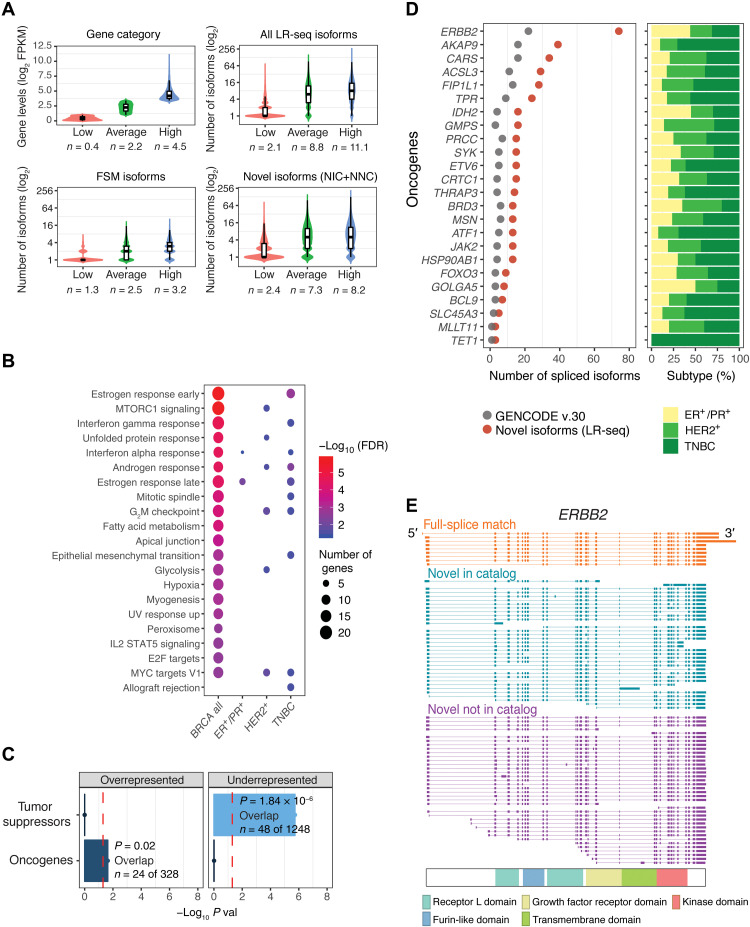
Fig. 2. Previously unidentified LR-seq isoforms detected in breast tumors are enriched in cancer-associated pathways and oncogenes.
(A) Correlation between gene expression levels from RNA-seq and number of transcript isoforms detected by LR-seq. Genes are binned on the basis of quartile expression: low (first quartile), average (second and third quartiles), and high (fourth quartile); where n is the mean log2 FPKM expression. Distribution of isoform numbers for each gene bin; where n is the mean absolute number of isoforms in the category. (B) Pathways significantly enriched [MSigDB, false discovery rate (FDR) < 0.05)] for genes with novel isoforms detected by LR-seq in all breast tumors or specific subtypes (HER2+, ER+/PR+, and TNBC). Bubble size denotes the number of genes with novel isoforms in each pathway, and color denotes significance. See also fig. S4A. (C) Enrichment analysis of oncogenes and tumor suppressors in genes with unannotated isoforms detected by LR-seq (hypergeometric test, P < 0.05, cutoff indicated by a red dotted line). Oncogenes and tumor suppressor gene lists are obtained from MSigDB and TSGene databases, respectively. (D) Number of novel LR-seq isoforms compared to annotated GENCODE isoforms for selected oncogenes (left). Barplots (right) indicate the tumor subtypes (colored as in Fig. 1B) where novel isoforms were detected. (E) Structure of LR-seq ERBB2 isoforms detected in breast tumors, grouped by isoform structural category from Fig. 1A. Included exons or introns are represented by solid boxes, spliced introns or exons by a line. The localization of ERBB2 protein domains is indicated.

