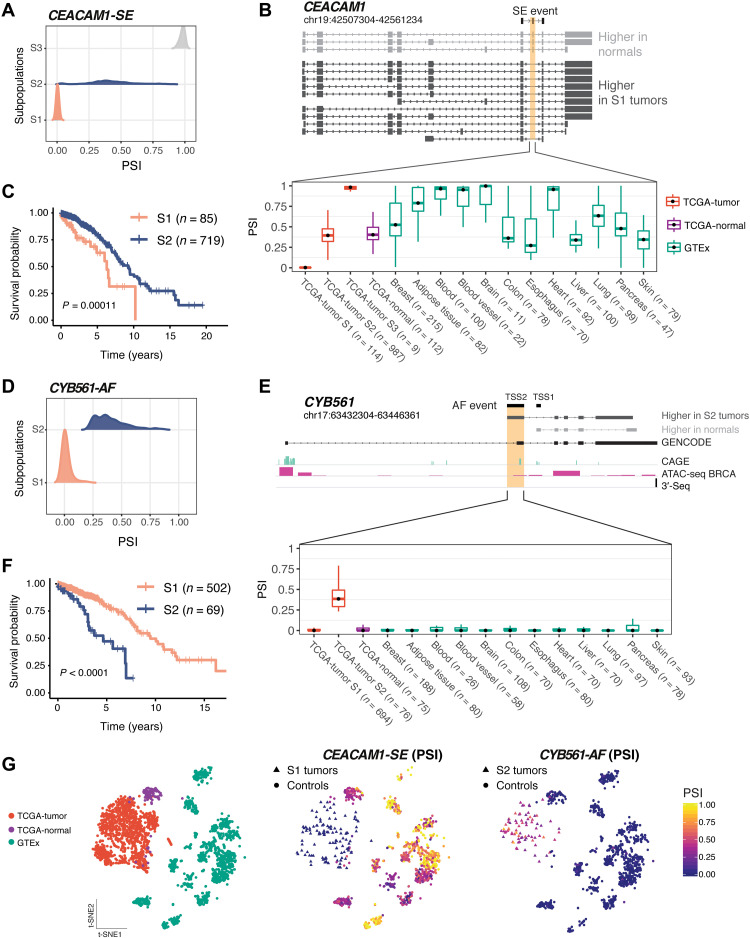
Fig. 5. AS events in CEACAM1 and CYB561 are tumor specific and associated with unfavorable prognosis in TCGA.
(A) TCGA tumor subpopulations (S1 to S3) detected by GMM clustering exhibit different PSI of exon 7 in CEACAM1. (B) Structure of CEACAM1 isoforms detected by LR-seq in breast tumors or normal tissues, highlighting the location of skipped exon 7 (top). Exon 7 PSI is shown in TCGA tumor subpopulations, TCGA normal adjacent breast tissues, and GTEX normal tissues (bottom). (C) Overall survival in TCGA breast cancer patients in S1 subpopulation, with CEACAM1 exon 7 skipping, and S2 subpopulation, with higher exon 7 inclusion (log-rank test). (D) TCGA subpopulations (S1 and S2) detected by GMM clustering exhibit different PSI values for an alternative first exon in CYB561. (E) Structure of CYB561 isoforms detected by LR-seq in breast tumors or normal tissues, highlighting the location of novel (TSS1) or known alternative (TSS2) transcriptional start sites (top). CAGE, ATAC-seq, and 3′-seq genomic tracks are displayed. PSI of the isoform containing the CYB561 TSS2 in TCGA tumor subpopulations, TCGA normal adjacent breast tissues, and GTEX normal tissues (bottom). (F) Overall survival in TCGA breast cancer patients in S1 subpopulation, with lower TSS2 inclusion, and S2 subpopulation, with higher TSS2 inclusion (log-rank test). (G) t-Distributed stochastic neighbor embedding (t-SNE) representations of the CEACAM1 and CYB561 AS events, showing samples per dataset (left) and colored by PSI levels for each tumor subpopulation and controls (right).

