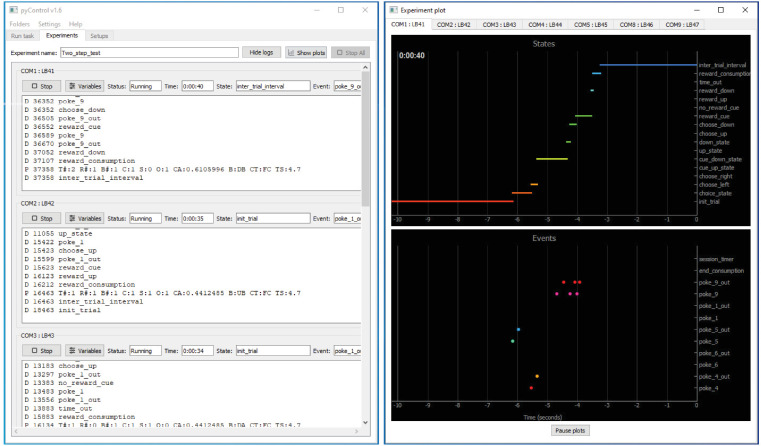
Figure 4. pyControl graphical user interface (GUI).
The GUI’s Experiments tab is shown on the left running a multi-subject experiment, with the experiment’s plot window open on the right showing the recent states and events for one subject. For images of the other GUI functionality, see the GUI docs.

