. 2021 Dec 13;10:e68224. doi: 10.7554/eLife.68224

Figure 1. Molecular classification of whole-brain cells in larval zebrafish.

(A) The t-distributed stochastic neighbor embedding (t-SNE) plot of 45,746 single-cell transcriptomes pooled from whole brains (n = 4) and four different individual brain regions (n = 2 each). The pooled cells were aggregated into 68 clusters, marked by a number. Each color-coded the major cell type as F. (B) The schematic showing different samples separately examined by single-cell RNA-sequencing on 10× Genomics Drop-seq platform: whole brain (n = 4), forebrain (Fore, n = 2), optic tectum (OT, n = 2), hindbrain (Hind, n = 2), and the region underneath the optic tectum (sub-OT, n = 2). OB: olfactory bulb; Tel: telencephalon; OT: optic tectum; Th: thalamus; H: hypothalamus; Pit: pituitary; Ce: cerebellum; MO: medulla oblongata. (C) Venn plots showing the differentially expressed genes in four major cell types identified by cell-type marker genes (vglut+, glutamatergic neurons, Glu; gad1b+, GABAergic neurons, Gaba; pcna+, neuroprogenitors, P; cx43+, radial astrocytes, R) in three brain regions (Fore, Hind, and OT). Commonly expressed genes in all cell types for a given brain region were identified as region-specific genes: six for forebrain (Fore), one for optic tectum (OT), and one for hindbrain (Hind), with genes listed below. (D) Dot plot showing the expression levels of region-specific marker genes in four major cell types (colored circles as C) in three brain regions. The gray level represents the average expression; dot size represents the percentage of cells expressing the marker genes. (E) Lawson-Hanson algorithm for non-negative least squares (NNLS) analysis showed cell clusters of Fore, OT, and Hind exhibited a high correlation with their counterparts of the juvenile zebrafish. Degree of correlation in marker genes is coded by the gray level and size of circle. (F) The dendrogram for the taxonomy of 68 identified clusters based on effector gene profiles (n = 1099). Main branches of neuronal and non-neuronal cells were classified into six branches (red dashed line) that include: I, cerebellum and habenula (hb); IIa, glutamatergic neurons (Glu); IIb, inhibitory neurons (Gaba); III, neuroprogenitors (P); IV, radial astrocytes (R); V, others, including microglia, endothelial cells, and oligodendrocytes. The colored dots and squares below indicate their regional origins and neurotransmitter-type, respectively.

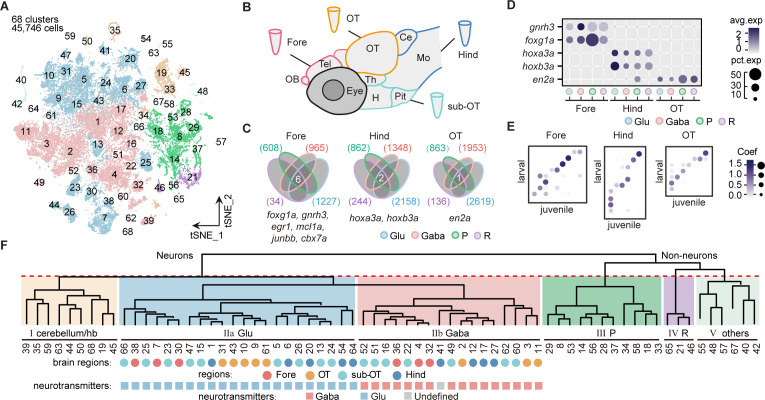
Figure 1—source data 1. Bioinformatics processing of raw reads of single-cell samples.
Figure 1—source data 2. The annotation of 68 clusters of whole-brain sample.
Figure 1—source data 3. The regional origins and neurotransmitter-type annotation of each whole-brain cluster with well-known markers.
Figure 1—source data 4. Top 20 marker genes of whole-brain larval zebrafish 68 clusters.
elife-68224-fig1-data4.xlsx (120.3KB, xlsx)
Figure 1—source data 5. Marker genes of major six cell type in whole brain.
elife-68224-fig1-data5.xlsx (370.2KB, xlsx)

Figure 1.

Figure 1—figure supplement 1. Molecular classification of whole-brain cells in larval zebrafish brain.

Figure 1—figure supplement 1.

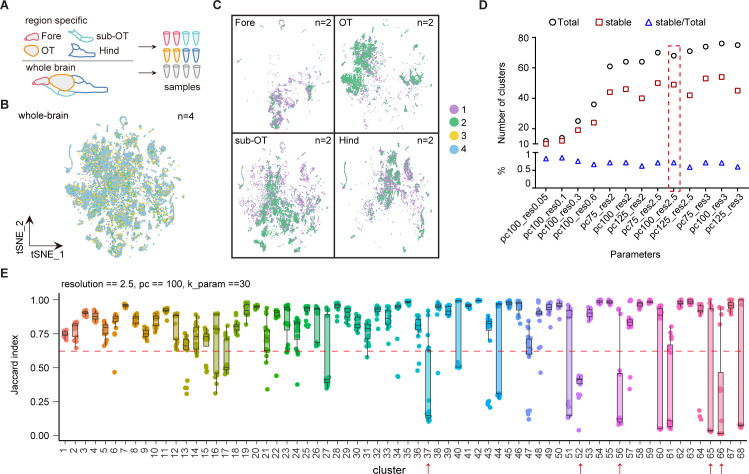
(A) The schematic showing each samples of whole brain and different brain regions. (B) t-Distributed stochastic neighbor embedding (t-SNE) plot of pooled single-cell transcriptome data from whole-brain samples (n = 4). Four whole-brain replicates were largely overlapping in the plot. Numbers of repeats are color-coded. (C) t-SNE plots of pooled single-cell transcriptome data from four different brain region (n = 2, each). Two replicates from forebrain (Fore), optic tectum (OT), hindbrain (Hind), and the region underneath the optic tectum (sub-OT) were largely overlapping in the plots. Different replicates were coded by different colors shown on the right. (D) The plot showing the number of total clusters, stable clusters, and the ratio of stable/total using different parameters to subsamples and re-clustering using R package ‘scclusteval’. (E) The JaccardRainCloundPlot gives an intuitive sense of the stability of clusters (with 0.6 cutoffs) with 68 whole-brain clusters in Figure 1A. Red line indicated the 0.6 cutoff of Jaccard index to evaluate the cluster stability. Red arrowhead indicated unstable clusters.
Figure 1—figure supplement 2. Molecular classification of whole-brain cells in larval zebrafish brain.

Figure 1—figure supplement 2.

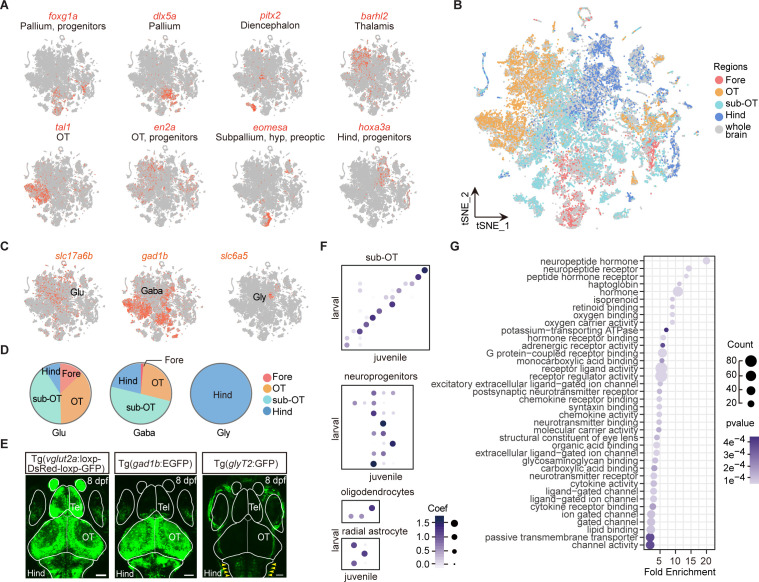
(A) t-Distributed stochastic neighbor embedding (t-SNE) plots showing the expression (in red) of specific markers (eomesa, foxg1a, dlx5a, pitx2 as markers for the forebrain; tal1, en2a as markers for the optic tectum; phox2a, and hoxa3a as makers for the hindbrain). (B) The 68 clusters obtained in Figure 1A were further marked by their regional origins in colors. (C) The t-SNE plots of glutamatergic marker vesicular glutamate transporter 2a (vglut2a, shown as slc17a6b), GABAergic marker gad1b, and glycinergic maker glycine transporter 2 (glyT2, shown as slc6a5). (D) Pie charts showing the compositions of glutamatergic, GABAergic, and glycinergic neurons in four different brain regions: forebrain (Fore), optic tectum (OT), and the region underneath the optic tectum (sub-OT) and hindbrain (Hind) (colored dots). (E) Representative images showing whole-brain maps of three major neuronal types using transgenic fishlines with specific labeling of neurons expressing different neurotransmitters. Glutamatergic neurons: Tg (vglut2a:loxp-DsRed-loxp-GFP); GABAergic neurons: Tg (gad1b:EGFP); glycinergic neurons: Tg (glyT2:GFP). Solid lines marked the boundaries between brain regions. Tel, telencephalon. Scale bars: 100 μm. Red arrowhead indicated the signal of glyT2+ neurons which were enriched in the hindbrain. (F) The NNLS (Lawson-Hanson algorithm for non-negative least squares) analysis using cluster-specific marker genes (top 20) showed that cell clusters of the sub-OT and non-neuronal type exhibit a high correlation with their counterparts of the juvenile zebrafish brain previously reported, with the degree of correlation in marker genes coded by the gray level and size of circle. (G) Gene Ontology (GO) analysis of 1402 variable genes in Figure 1A. Here, we shown the effector genes related to different molecular function. Dots represent term enrichment, degrees of enrichments are color-coded, and sizes of dots represent the percentage of each enrichment category.