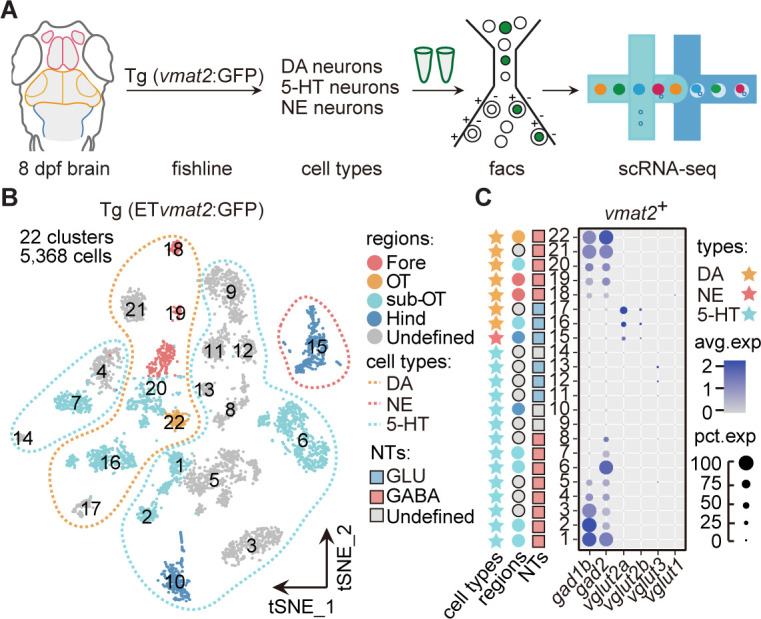
Figure 2. Molecular classification of neuromodulator-type neurons.
(A) The schematic showing the procedure of collecting single-cell transcriptomes of neuromodulator neurons with fluorescence-activated cell sorting (FACS). Using Tg (ETvmat2:GFP) fishline, we could isolate dopaminergic (DA), serotonergic (5-HT), and norepinephrinergic (NE) neurons. (B) The t-distributed stochastic neighbor embedding (t-SNE) plot of 5368 cells obtained from Tg (ETvmat2:GFP) fishline expressing monoaminergic neuromodulators, showing 22 clusters, each marked by a number, color-coding brain regions and cell type of each cluster. (C) Dot plot showing the expression of glutamatergic marker (vglut2a/vglut2b/vglu1/vglu3) and GABAergic marker (gad1b/gad2) in each of the 22 vmat2+ clusters in B. The neurotransmitter phenotypes were color-coded. Empty squares depict the ones with undefined neurotransmitter phenotypes. The average expression levels of these genes for all cells in each cluster were coded by the gray level. The percentage of cells expressing each gene within each cluster was coded by dot size.


