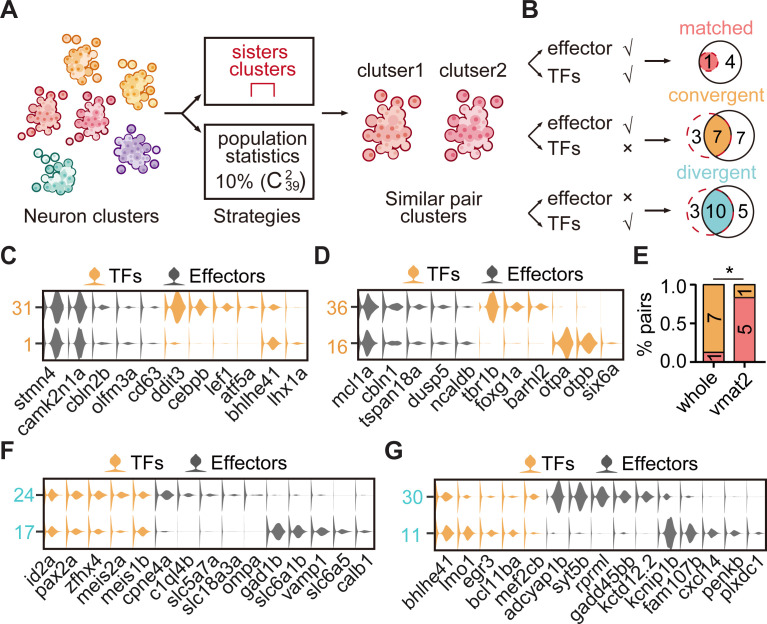
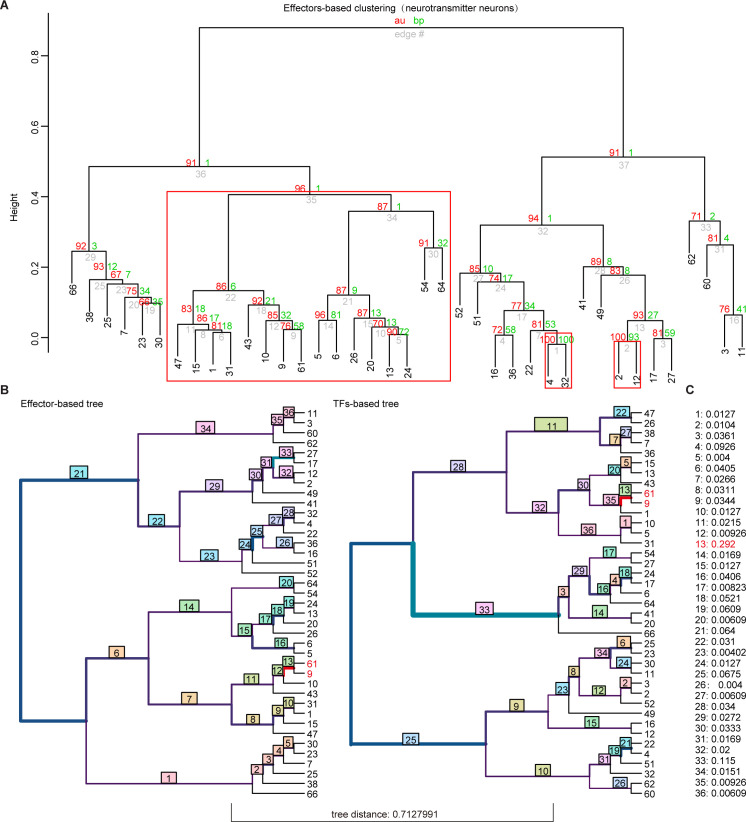
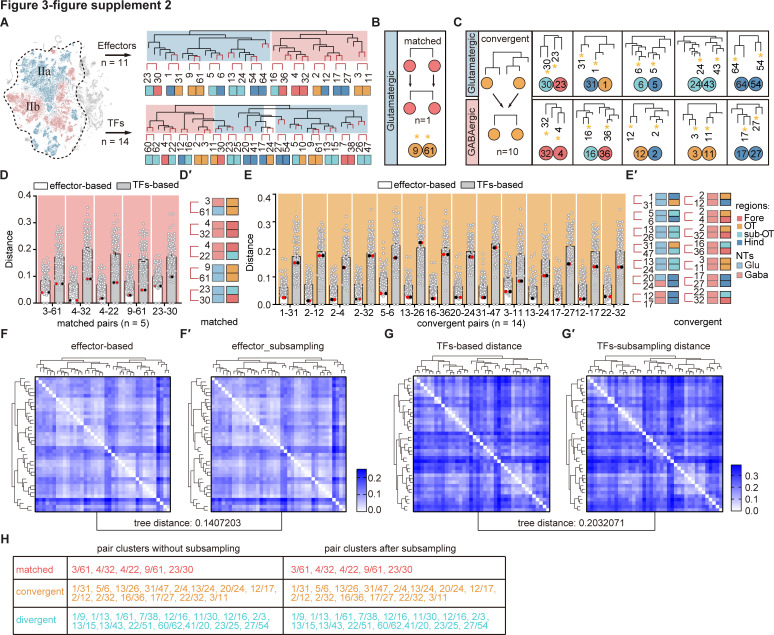
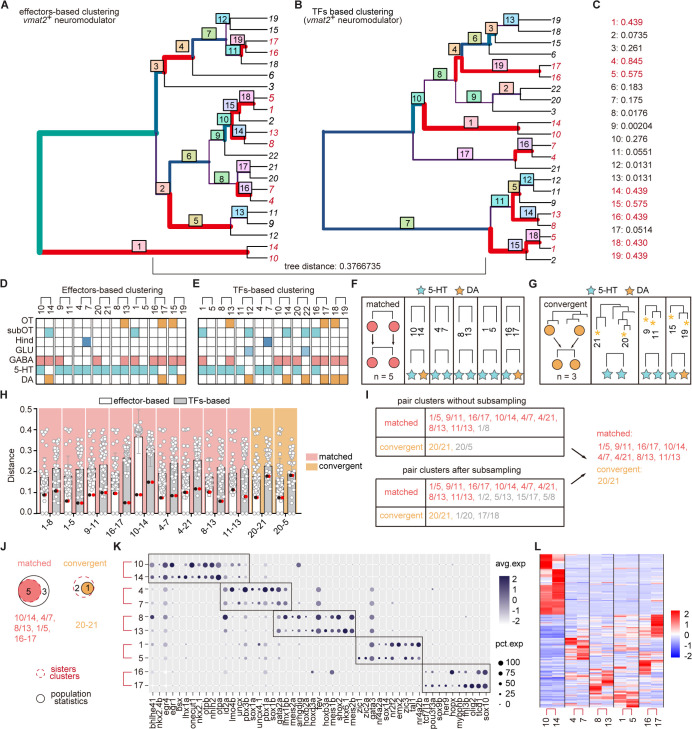
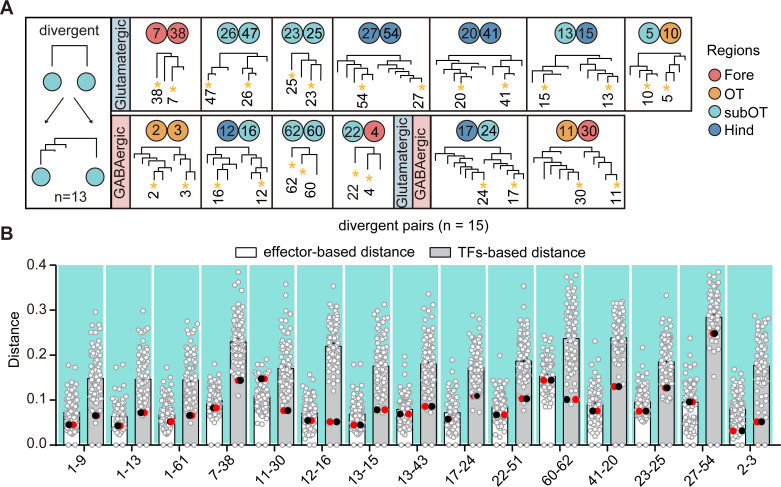
Figure 3. The transcription factor (TF) regulatory landscape in whole-brain neuronal clusters.
(A) Schematic showing the strategies to assess the cluster similarity based on effector gene and TF profiles. We focused on clusters of whole-brain glutamatergic/GABAergic neurons and neuromodulator neurons. Similar pair clusters were identified by two strategies: the first strategy was based on hierarchical sister clusters. The second strategy was based on population-level statistical analysis, in which we calculated and ranked the distances of every two clusters from 39 neurotransmitter-type clusters () and chose the ones with the lowest 10% distance as similar pair clusters. (B) Left: schematic showing the criteria of three patterns: pair clusters that were similar in both TF and effector gene profiles as ‘matched pattern’, those pair clusters that were similar in effector gene profiles but not in TF profiles as ‘convergent pattern’, and those pair clusters that were similar in TF profiles but not in effector gene profiles as ‘divergent pattern’. Right: the plot showing the number of each pattern using two strategies in A. The red dashed circle showing the number of cluster pairs with given pattern based on hierarchical sister cluster analysis; the black solid circle showing the number of cluster pairs with given pattern based on population-level statistical analysis. (C–D) Violin plots showing the expression of TFs (yellow) or effector genes (black) in glutamatergic and GABAergic similar pair clusters of convergent pattern. (E) The bar plot showing the proportions of different patterns for neuronal clusters with neurotransmitter or neuromodulator types. The numbers of each pattern were indicated. Fisher′s exact test was used to test the significant association of different patterns, p = 0.02564, *p < 0.05. (F–G) Violin plots showing the expression of TF profiles (yellow) or effector gene profiles (black) in neuronal clusters of divergent pattern.

