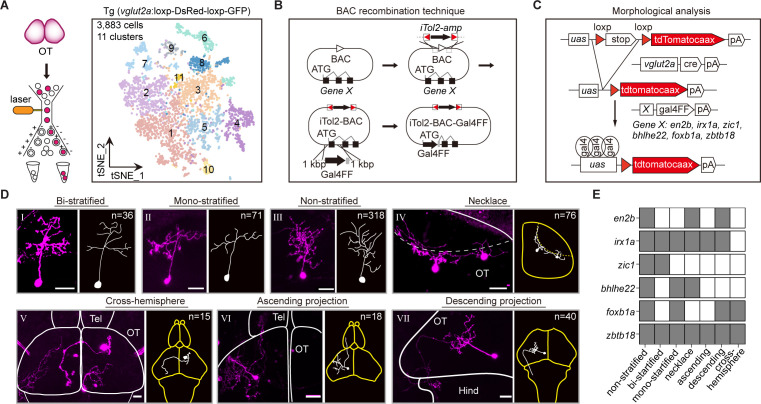
Figure 4. Combinatorial transcription factors (TFs) in marking tectal morphological subclasses.
(A) Left: the schematic showing the procedure of collecting single-cell transcriptomes of tectal glutamatergic neurons with fluorescence-activated cell sorting (FACS) using Tg (vglut2a:loxp-DsRed-loxp-GFP) fishline. Right: the t-distributed stochastic neighbor embedding (t-SNE) plot of 3, 883 cells obtained from Tg (vglut2a:loxp-DsRed-loxp-GFP) fishline labelling glutamatergic neurons in the optic tectum showing 11 clusters, each color-coded and marked by a number. (B) Schematic showing the designing of the Gal4FF BAC plasmids for six TF marker genes, covering all 11 clusters of tectal glutamatergic neurons shown in A. (C) Schematic showing the method for single TF-based labeling of tectal glutamatergic neurons. CRE expressed in glutamatergic neurons was used to excise loxp and drive fluorescent tdTomatocaax expression. (D) Representative images of seven subclasses of tectal glutamatergic neurons with distinct morphological subclasses using the method described in (B–C). The number of neurons collected for each subclass was shown. Insets depicted the morphological characteristics. Neurons with ascending and descending projections were those projecting to the forebrain and hindbrain, respectively. Solid lines marked the boundaries between brain regions. Dashed lines marked the boundary of the tectal neuropile. Scale bars: 20 μm. (E) The matrix showing the expressions of six TFs in each of seven morphological subclasses. The black squares represented TFs could label particular morphological subclasses, and no expression was indicated by white squares.


