. 2021 Dec 13;10:e68224. doi: 10.7554/eLife.68224

Figure 5. The post-transcriptional regulatory landscape in neurons with different terminal features but similar transcription factor (TF) profiles.

(A) Dot plot showing Gene Ontology (GO) analysis of differentially expressed genes between each pair clusters with divergent pattern. Red highlighted the category of post-transcriptional regulators. The number of genes in each category was coded by dot size, p.adjust of each category was color-coded. (B) Violin plots showing the expression of genes encoding TFs (yellow), RNA-binding proteins (RBPs) (blue), and effector genes (black) in two pairs of neuronal clusters with divergent pattern (7/38 were glutamatergic neurons, 12/16 were GABAergic neurons). (C) 3D pie plot showing the functional annotation of differentially expressed RBP genes identified in A. (D) Bar plot showing the number of pattern-specific RBPs per pair in different patterns. Each pattern was color-coded. (E) Bar plot showing the effector binding target proportion of pattern-specific RBPs. Each pattern was color-coded. (F) Bar plot showing the percentage of one RBP used as differentially expressed genes between pair clusters with different patterns.

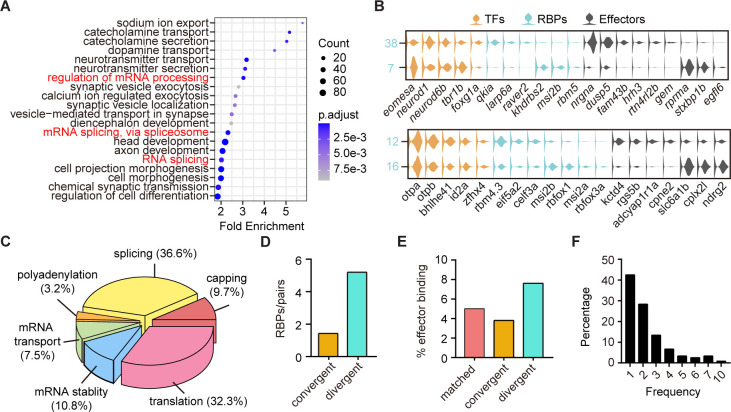
Figure 5—source data 1. Differentially gene expression between sister pair clusters with matched, convergent, and divergent patterns.
Figure 5—source data 2. The p-value of differential gene expression between sister pair clusters.
Figure 5—source data 3. Annotation the function of RNA-binding proteins (RBPs).
Figure 5—source data 4. The binding sites of pattern specific RNA-binding proteins (RBPs).
elife-68224-fig5-data4.xlsx (151.5KB, xlsx)
Figure 5—source data 5. The combinatorial usage of RNA-binding proteins (RBPs).

Figure 5.

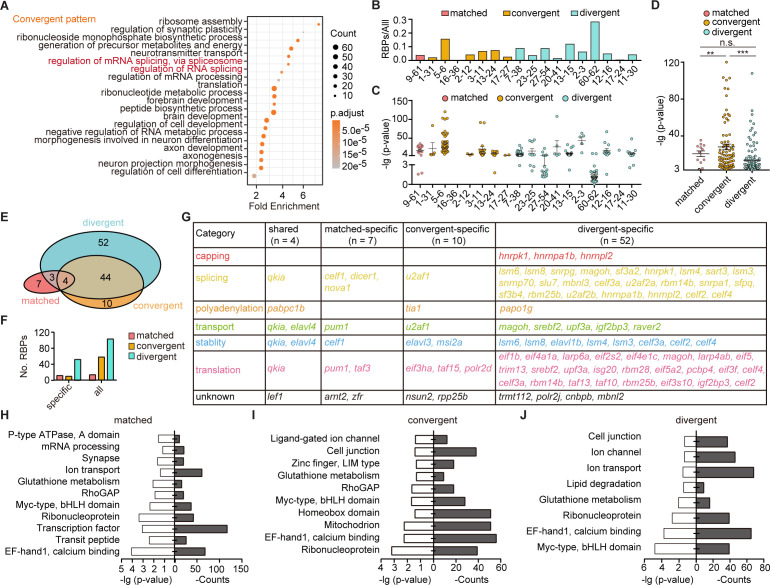
Figure 5—figure supplement 1. The post-transcriptional regulatory landscape in neurons with different terminal features but similar transcription factor (TF) profiles.

Figure 5—figure supplement 1.

(A) Dot graph showing the Gene Ontology (GO) analysis of differentially expressed genes between neuronal clusters with convergent pattern. Red highlighted the category of post-transcriptional regulators. The number of genes in each category was coded by dot size. The p.adjust of each category was color-coded. (B) Bar plot showing the ratio of differentially expressed RNA-binding proteins (RBPs) and all markers between pairs with matched, convergent, and divergent patterns. Different patterns are color-coded. (C) Dot plot showing the p-value of RBPs used as differentially expressed genes between pair clusters with matched, convergent, and divergent patterns. Different patterns are color-coded (mean ± SEM). (D) Scatter plot showing the p-value of RBPs which were used to distinguish pair clusters in each pattern. Each pattern was color-coded (mean ± SEM, matched: 20.73 ± 3.086, convergent: 28.1 ± 3.079, divergent: 13.33 ± 1.493, **p-value < 0.01, ***p-value < 0.001, ns, no significant difference; t-test). (E) Venn plot showing the RBPs used as differentially expressed genes between paired clusters with different pattern. Each pattern was color-coded. (F) Bar plot showing the number of pattern-specific RBPs in each patterns. Each pattern was color-coded. (G) The matrix showing the functional category of RBPs which specifically distinguished pair clusters with matched, convergent, and divergent patterns or shared by all three patterns. Different RBPs functions are color-coded. (H–J) Bar plots showing the GO analysis of target sites of pattern-specific RBPs (H, matched pattern; I, convergent pattern; and J, divergent pattern) using the oRNAment database.