. 2021 Dec 24;10:e70506. doi: 10.7554/eLife.70506

Figure 2. Automated on-grid lamella preparation of Sum159 breast cancer cells.

(A) Focused ion beam (FIB) image of a cell prior to lamella preparation. Yellow rectangles indicate milling patterns where material is subsequently removed. (B) Micro-expansion joints (white arrowheads) and lamella (yellow arrowheads) milled to a target thickness of 1 µm. (C) Lamella after fine milling to a target thickness of 300 nm. (D) Transmission electron microscopy (TEM) overview of lamella in (C). Frames indicate examples of tilt series acquisition positions (out of eight acquired on this lamella) and the local thickness determined from reconstructed tomograms. Nucleus, lipid droplets (LD), and mitochondria (M) are observable. * indicates an ice crystal introduced during transfer between FIB and TEM. Area indicated by (E) is enlarged. (E) A slice through the tomogram depicts the cytosol with microtubules (MT) and a mitochondrion (M). Inset shows a ribosome subtomogram average determined from the dataset collected on this single lamella (four tomograms; 4378 subtomograms; 24 Å resolution).

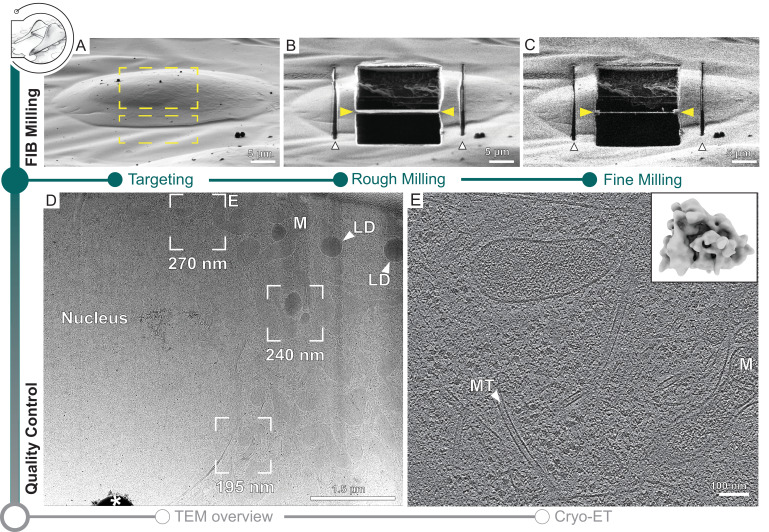
Figure 2.

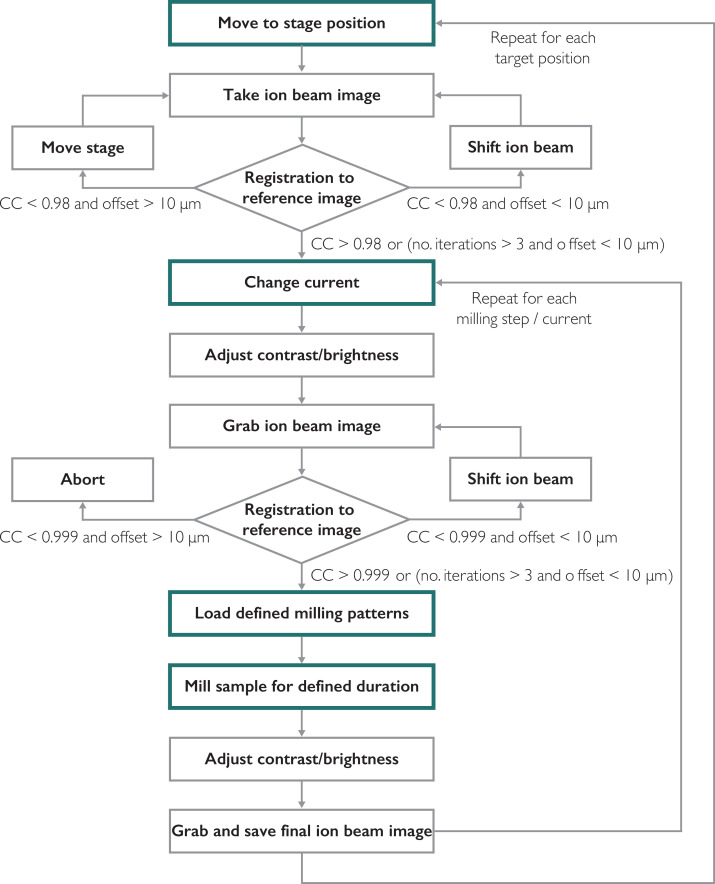
Figure 2—figure supplement 1. Functions executed by SerialFIB for preparation of on-grid lamellae.

Figure 2—figure supplement 1.

Main steps of the milling procedure are highlighted in green boxes. Gray boxes indicate subsequent steps performed by the software. Rhombus boxes indicate decision points for the image-based alignment.
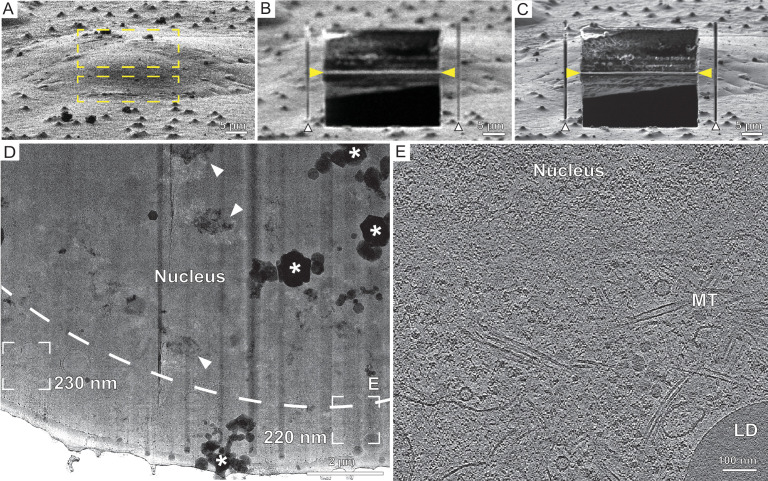
Figure 2—figure supplement 2. Automated on-grid lamella preparation of HeLa cells.

Figure 2—figure supplement 2.

(A) Focused ion beam (FIB) image of a cell prior to lamella preparation. Yellow rectangles indicate milling patterns where material is subsequently removed. (B) Micro-expansion joints (white arrowheads) and rough lamella (yellow arrowheads) milled to a target thickness of 1 µm. (C) Lamella after fine milling to a target thickness of 300 nm. (D) Transmission electron microscopy (TEM) overview of lamella in (C). Frames indicate examples of tilt series acquisition positions (out of three acquired on this lamella) and the local thickness determined from reconstructed tomograms. Nuclear envelope delineated by a dashed line. Vertical dark stripes (curtains) commonly originate from dense lipid droplets or surface fiducials, which resist milling. Milling protocol was adjusted to minimize curtaining (Supplementary file 1). * denotes ice crystal contamination from transfer between FIB and TEM. Arrowheads point to crystalline ice reflections in the nucleus. Area indicated by (E) is enlarged. (E) A slice through the tomogram depicts the cytosol with microtubules (MT), a lipid droplet (LD), and the nucleus.
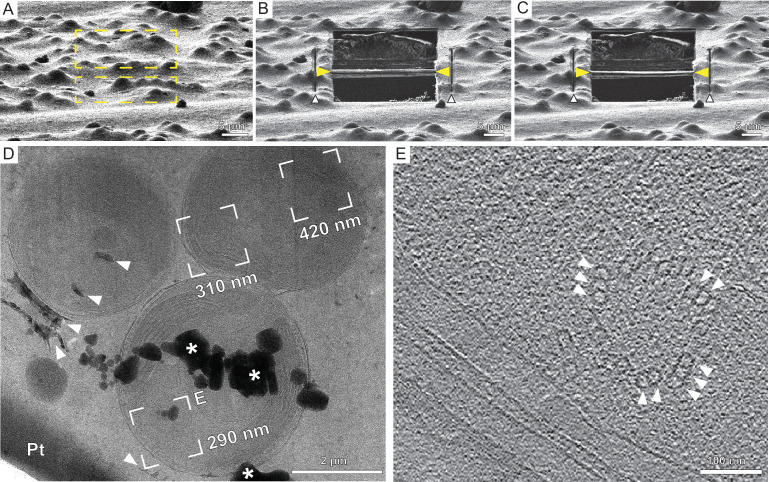
Figure 2—figure supplement 3. Automated on-grid lamella preparation of E. huxleyi cells.

Figure 2—figure supplement 3.

(A) Focused ion beam (FIB) image of an agglomeration of cells prior to lamella preparation. Yellow rectangles indicate milling patterns where material is subsequently removed. (B) Micro-expansion joints (white arrowheads) and rough lamella (yellow arrowheads) milled to a thickness smaller than the target of 1 µm due to prolonged milling times. (C) Final lamella after fine milling to a target thickness of 300 nm. (D) Section of the transmission electron microscopy (TEM) overview of the lamella showing three individual cells. Frames indicate examples of tilt series acquisition positions (out of 10 acquired on this lamella) and the local thickness determined from reconstructed tomograms. Dense structures include intra- and extra-cellular calcium carbonate crystals (top two and bottom three white arrowheads, respectively) are observable, as well as the protective Pt layer. Milling protocol was adjusted to minimize curtaining from the dense crystalline structures (Supplementary file 1). * denotes ice crystal contamination from transfer between FIB and TEM. (E) A slice through the tomogram indicated by (E) in the TEM overview in (D) depicts the cytosol with microtubules (white arrowheads) assembled into doublets and triplets constituting a basal body of a cilium.
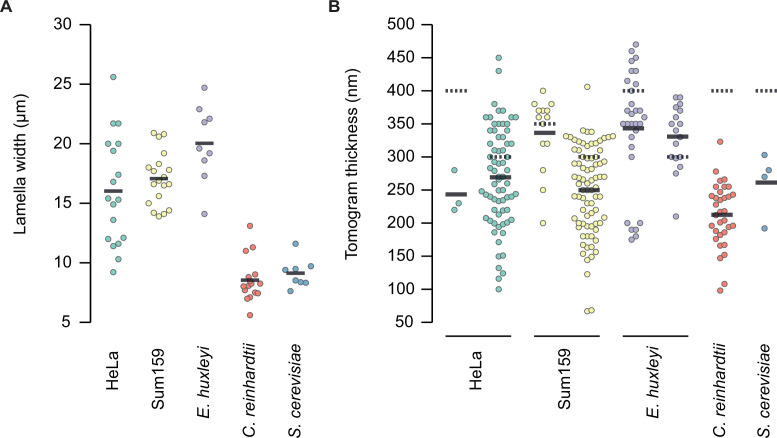
Figure 2—figure supplement 4. Width (A) and thickness (B) of successfully prepared lamellae from five eukaryotic cell types.

Figure 2—figure supplement 4.

Multiple tomograms were collected per lamella. Thicknesses were measured per tomogram. Solid line indicates the mean thickness; dotted line indicates the target thickness. Data represents lamellae prepared over a series of independent focused ion beam (FIB) sessions: six grids for HeLa; three grids for Sum159; two grids for E. Huxleyi; two grids for C. reinhardtii; and one grid for S. cerevisiae.
Figure 2—video 1. Tomographic volume of a Sum159 breast cancer cell related to Figure 2E depicting the cytosol with microtubules (MT) and a mitochondrion (Mito) next to the nucleus.
Download video file (43.8MB, mp4)
Figure 2—video 2. Tomographic volume of a HeLa cell related to Figure 2—figure supplement 2E depicting the nuclear periphery, and the cytosol with microtubules (MT) and a lipid droplet (LD).
Download video file (26.8MB, mp4)
Figure 2—video 3. Tomographic volume of E. huxleyi cells related to Figure 2—figure supplement 3E depicting the cytosol with the basal body of a cilium.
Download video file (21.3MB, mp4)