. 2021 Dec 24;10:e70506. doi: 10.7554/eLife.70506

Figure 3. Three-dimensional correlative light and electron microscopy (3D-CLEM)-targeted lamella preparation of HeLa cells.

Green modules represent tasks performed with SerialFIB; orange, with 3D Correlation Toolbox (3DCT). (A) Scanning electron microscopy (SEM) and (B) focused ion beam (FIB) images of a cell. Overlaid are maximum intensity projections of cryo-fluorescence light microscopy (cryo-FLM) signal corresponding to lipid droplets (red), mitochondria (cyan), and beads (yellow). Correlation with the FIB image is aided by 3D transformation of fiducials detected in the SEM image. (C) Correlated positions of lipid droplets (red dots) imported into SerialFIB. White arrowhead indicates the targeted lipid droplet. Yellow arrowheads indicate the targeted lamella position; yellow lines indicate milling extreme positions. (D) Final lamella after automated FIB milling. Red dots indicate the position of lipid droplets following re-correlation with the FIB image after milling. White triangles highlight micro-expansion joints. (E) Masking of FLM volumes based on lamella outline in the SEM image (orange) and lamella position in the FIB image (orange double arrow in D). A 300 nm FLM virtual slice centered on the lamella is shown. (F) Overlay of the best-fitting fluorescence plane with the transmission electron microscopy (TEM) image of the lamella. Different heights were sampled in relation to the FIB image post-milling to determine the plane where bead and lipid droplet fluorescence signal overlaps best with the TEM image (see Materials and methods). White frame indicates the targeted lipid droplet and area of cryo-ET acquisition. * denotes ice crystal contamination from transfers. (G) Tomographic slice of area indicated in (F) depicts the cytosol with a microtubule (MT) and a lipid droplet (LD).

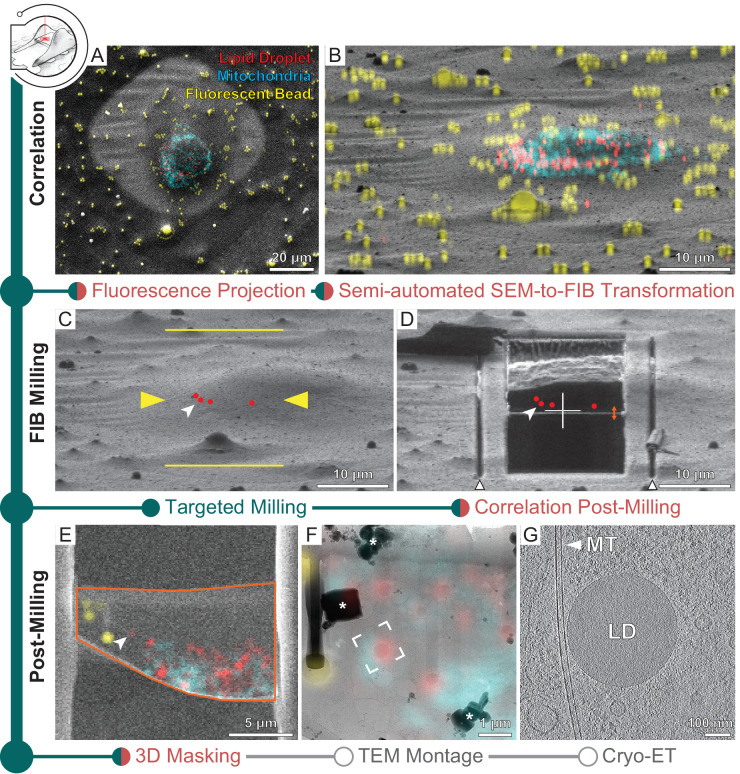
Figure 3.

Figure 3—figure supplement 1. New 3D Correlation Toolbox (3DCT) features.

Figure 3—figure supplement 1.

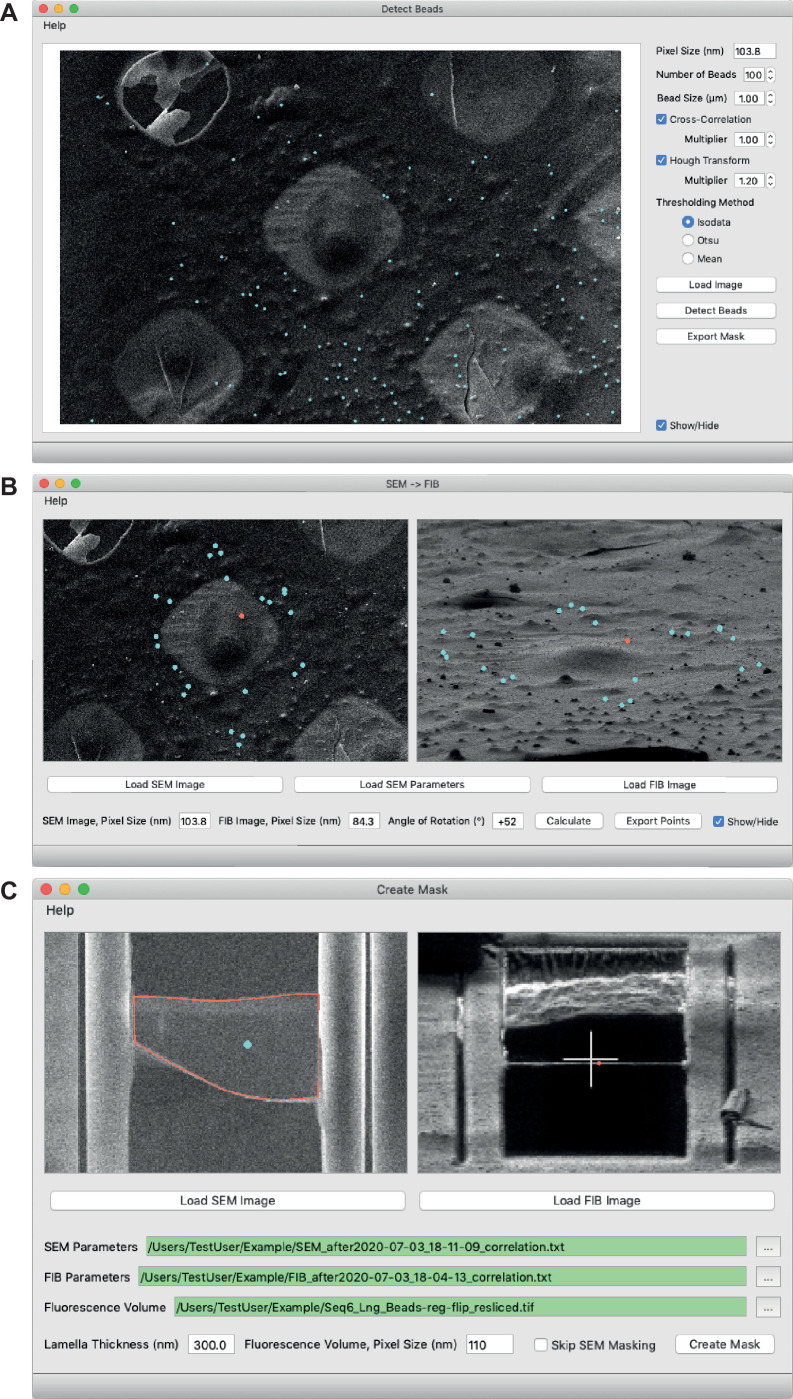
(A) Semi-automated detection of beads in scanning electron microscopy (SEM) images. Different methods for detection are available. Blue dots indicate beads found. (B) Rotation of fiducials from SEM (left) to focused ion beam (FIB) (right) orientation. Blue dots in the SEM image indicate fiducial beads used for correlation. Red dot in both images indicates a common feature defined manually, which serves as the center of rotation. Blue dots in the FIB image indicate the rotated positions. (C) 3D mask creation for generation of a virtual slice in the cryo-fluorescence light microscopy (cryo-FLM) volume. Red outline in the SEM image (left) indicates lamella boundary, and blue dot indicates lamella interior. Red dot in the FIB image (right) indicates the lamella position.
Figure 3—figure supplement 2. Examples of successful 3D-targeted milling of lipid droplets.

Figure 3—figure supplement 2.

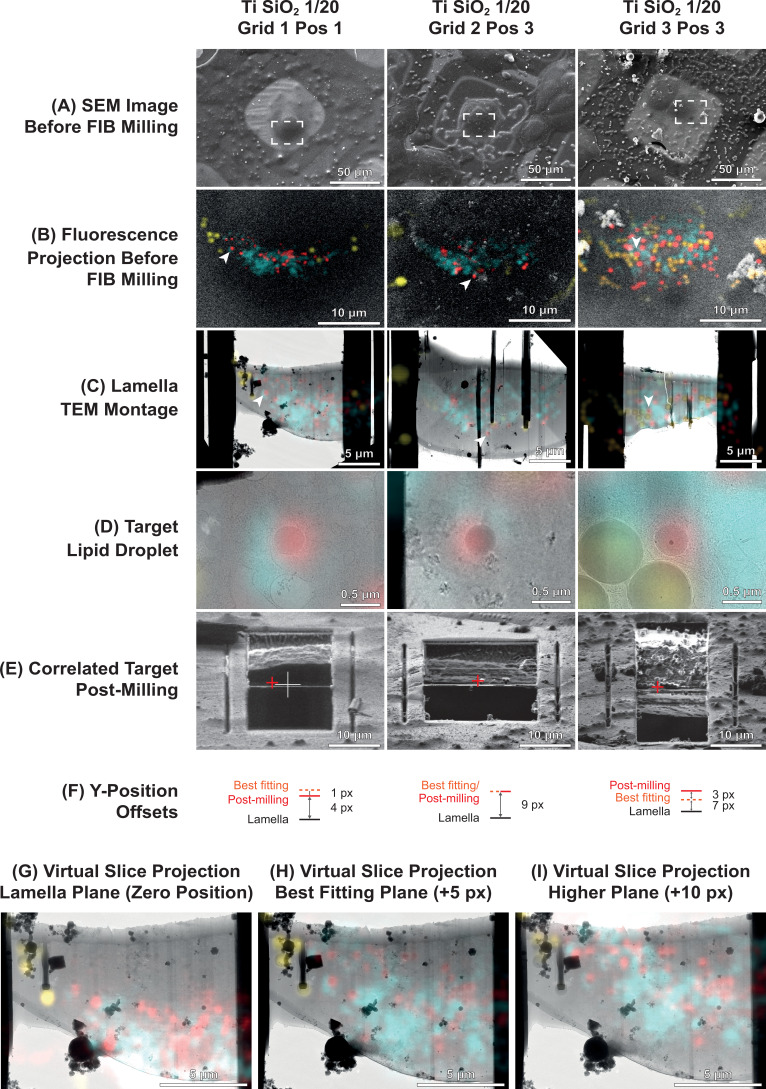
(A) Scanning electron microscopy (SEM) images before focused ion beam (FIB) milling. (B) Cryo-fluorescence light microscopy (cryo-FLM) volumes projected onto SEM images before FIB milling in the areas indicated in (A). Red, lipid droplets; cyan, mitochondria; yellow, fiducial beads. White arrowhead indicates the targeted lipid droplet. (C) Transmission electron microscopy (TEM) montage of the lamella, overlaid with the best-fitting fluorescence virtual slice. The best-fitting slice was determined by sampling slices of the cryo-FLM volume corresponding to different heights (along the y axis) in the FIB image generated using the 3D Correlation Toolbox (3DCT) masking utility. See panels (GI). Vertical black stripes in the montage are curtaining artifacts due to different ablation rates of the fiducial beads. (D) Zoom-in view of the targeted lipid droplet (arrowheads in C). (E) FIB view of the final lamella. Red cross indicates the correlated position of the target lipid droplet based on the final FIB image post-milling. (F) Offsets of correlated positions post-milling and positions of the best-fitting slice relative to the final lamella position in the FIB image, tabulated in Supplementary file 2. (G-I) Determination of the best-fitting slice for Grid 1 Position 1 by matching of lipid droplet (red) and microbead fiducial (yellow) fluorescence at different heights in the FIB image with the lamella TEM montage.
Figure 3—figure supplement 3. Local deformations of specimens.

Figure 3—figure supplement 3.

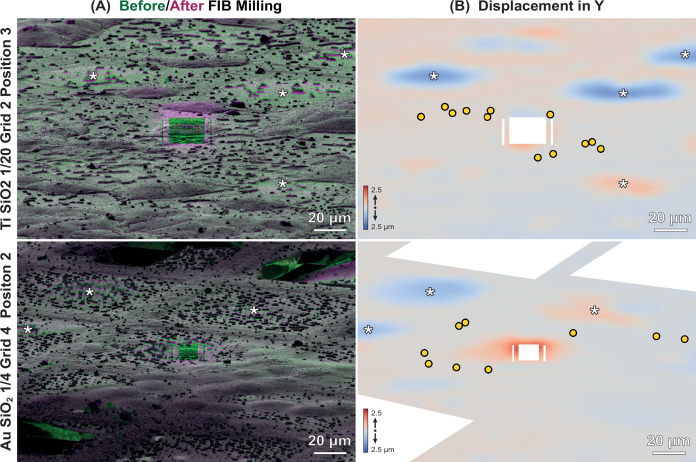
(A) Overlay of representative focused ion beam (FIB) images of HeLa cells on Ti SiO2 1/20 (top) or Au SiO2 1/4 (bottom), before (green), and after milling (magenta). Grid and position numbering corresponds to Supplementary file 2. (B) Heatmap depicting displacements in the y-direction of FIB image determined by 2D elastic B-spline registration using bUnwarpJ (Arganda-Carreras et al., 2006). Red, up; blue, down. Yellow circles represent beads used for correlation in 3D Correlation Toolbox (3DCT). White areas were excluded from the analysis, which included broken squares, surface contaminants, and the site of milling. White asterisks indicate unmilled squares, which exhibited strong deformations (up to 2.5 μm).
Figure 3—video 1. Tomographic volume of a HeLa cell related to Figure 3G depicting the cytosol with microtubules (MT), a lipid droplet (LD), and a multivesicular body (MVB).
Download video file (30.2MB, mp4)
* denotes ice reflections originating from incomplete vitrification.