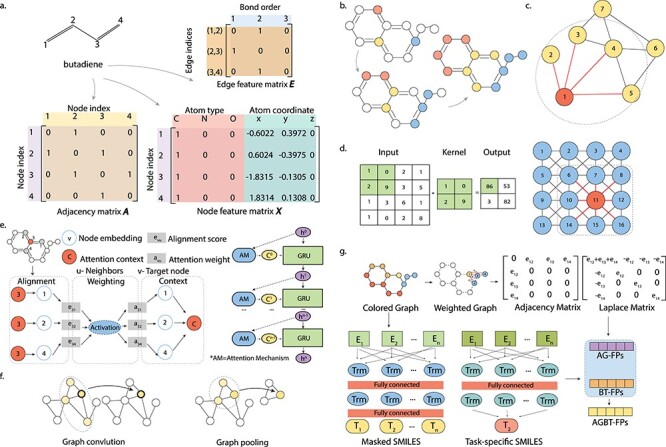
Figure 3.

Illustration of graph representations and graph convolution. (A) Graph representation matrices, namely, the Adjacency matrix A, node feature matrix X and edge feature matrix E, of the butadiene molecule. (B) Information flows through graph convolution. (C) The graph convolution operation in a GNN architecture, the node of interest is colored in red and edges connected to the node of interest are colored in red. (D) The scheme of a convolution operation in a CNN architecture. On the left, an example 2-by-2 convolutional kernel and the corresponding input and output are shown. On the right, the node of interest is colored in red and the kernel is represented by the dashed square. (E) The scheme of the Attentive FP model. The graph attention mechanism is introduced as a trainable feature to represent both topological adjacency and intramolecular interactions between atoms with large topological distances. For each target atom and its neighboring atoms, state vectors are used to describe the local environment through node embedding. These state vectors are progressively updated to include more information from neighborhoods through the attention mechanism, where state vectors are aligned and weighted to obtain attention context vectors and gated recurrent unit layers are used to update state vectors. (F) Instead of predicting a specific property of a molecule, a GCN-based approach was proposed to predict universal properties of molecules as well as materials. (G) The scheme of the AGBT method that extracts information from weighted colored algebraic graphs of molecules. This method combines two types of molecular representations: the BT features generated from bidirectional transformers treatment on SMILES, and the AG features generated from eigenvalues of the molecular graph’s Laplacian matrix.
