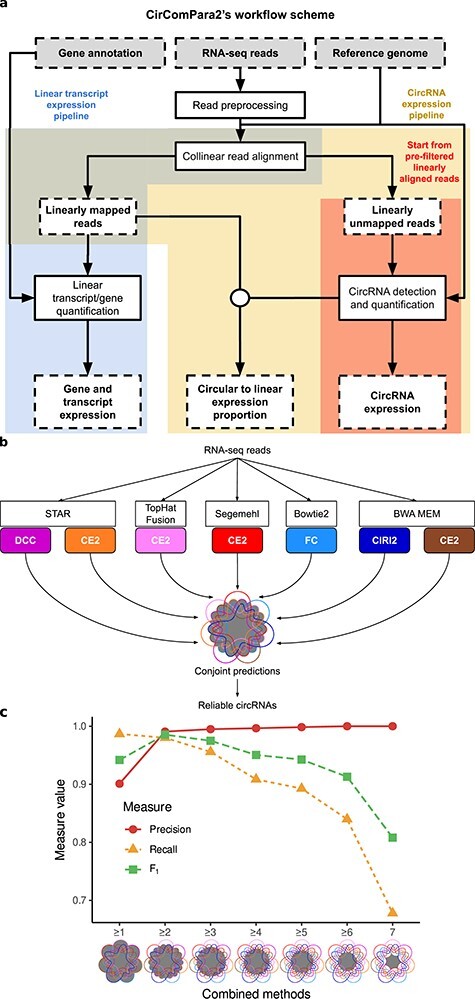
Figure 2 .

The CirComPara2 workflow and approach. A, Boxes with dashed contour indicate input and output data; boxes with solid-line contour indicate computing tasks; the circular connector indicates merging data. Background colours highlight the different pipeline branches (linear transcript analysis in blue, full circRNA analysis in yellow and strict circRNA analysis in red). B, A detail of the CirComPara2 strategy (‘CircRNA detection and quantification’ box in a) showing the embedded circRNA detection methods (coloured rounded corner boxes) with the respective chimeric read aligners (white boxes). The central Venn diagram represents the optimized combination of method prediction intersections implemented by CirComPara2 with circRNAs conjointly detected by two or more methods (grey filled intersections) retained as default. Method abbreviations as in Figure 1. C, Precision (red), recall (yellow) and F1-score (green) for different numbers of methods that conjointly identified the circRNAs: ≥1 indicates that at least one method identified the circRNAs, or, in other words, it represents the union of all single methods predictions; ≥2 indicates the circRNAs conjointly predicted by two or more methods; ≥3 indicates the circRNAs commonly identified by any combination set of at least three methods; similar is for the larger number of methods sharing the predictions. The ‘7’ indicates circRNAs commonly predicted by all the methods. The grey-filled parts in Venn diagrams show the intersections considered by the conjoint method combinations.
