Figure 3 .

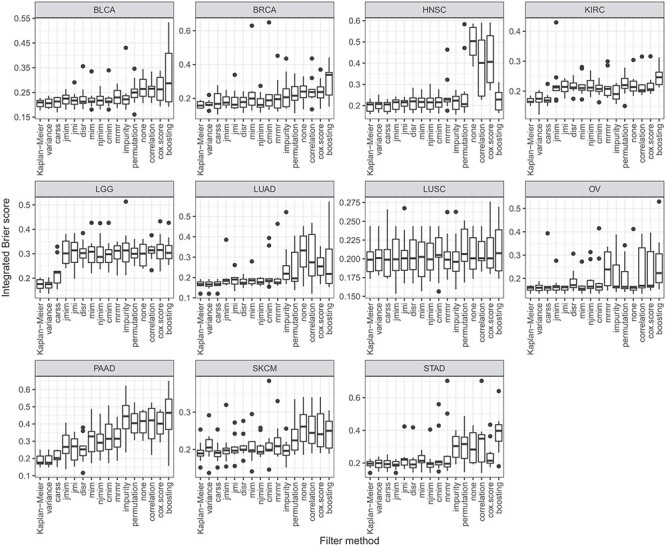
Boxplots of the integrated Brier score of the best configurations of the 10 outer cross-validation iterations per data set. Each boxplot represents 10 performance values. Small values indicate a good predictive performance.

Boxplots of the integrated Brier score of the best configurations of the 10 outer cross-validation iterations per data set. Each boxplot represents 10 performance values. Small values indicate a good predictive performance.