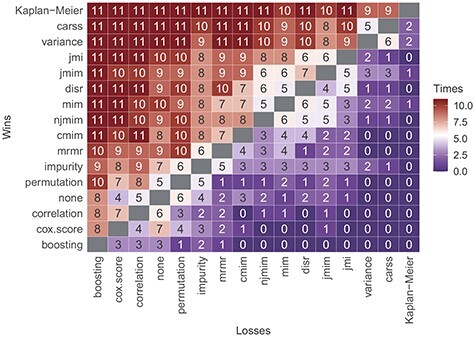
Figure 4 .

Number of data sets on which the filter method displayed in the row achieves a lower mean integrated Brier score (corresponding to a better performance) than the filter method displayed in the column. The filter methods are ordered by the sums of the rows, that is, the total number of wins against any of the other filter methods on any of the 11 data sets.
