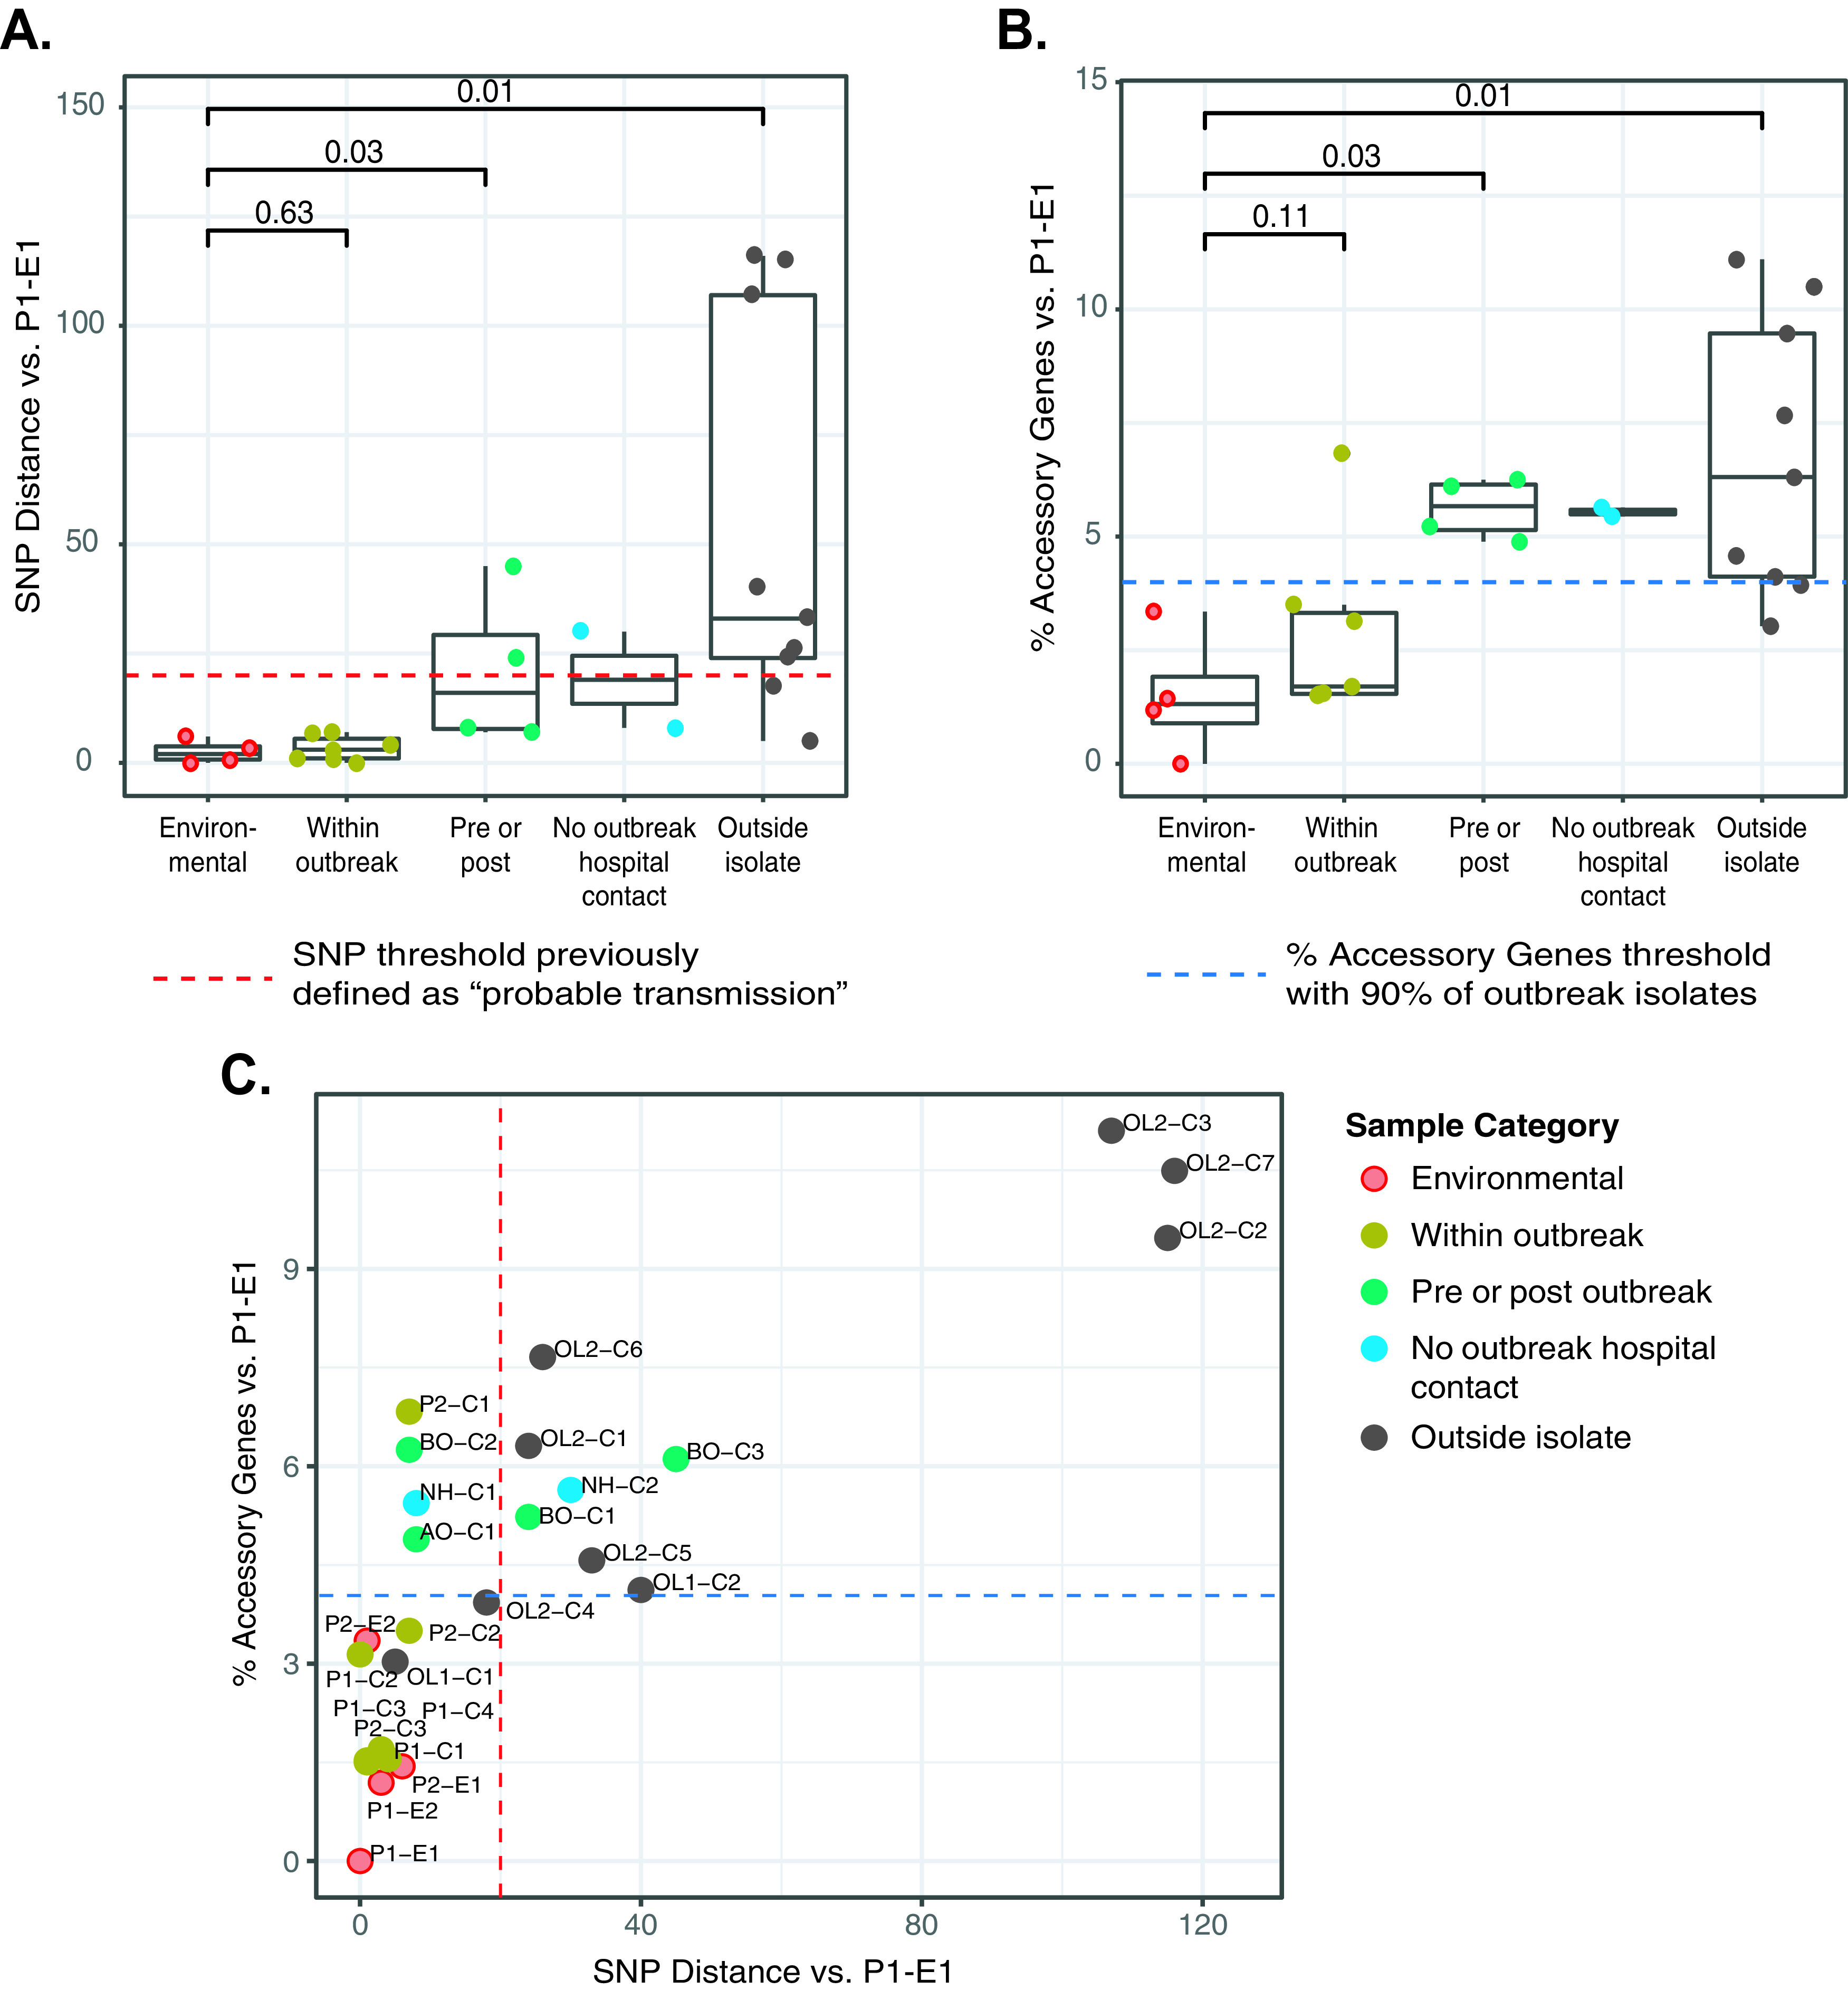
FIG 2.

Genomic similarities of M. abscessus subsp. abscessus isolates in the study cohort by isolate categories. (A) Genome-wide SNP distances relative to a reference environmental strain collected during phase 1 of the outbreak (P1-E1) are shown on the y axis by sample categories (x axis). The previously described 20-bp SNP threshold is shown as a red dashed line. (B) Accessory genome variation for all isolates compared to P1-E1 is shown on the y axis as percent accessory genes. Sample categories are indicated on the x axis. The percent accessory gene threshold (4%) that includes 90% of clinical outbreak isolates is shown as a blue dashed line. (C) Integrated scatterplot of core genome SNPs versus percent accessory genes relative to P1-E1. Samples are color coded by sample category, and threshold lines are indicated as for panels A and B. Abbreviations: AO, after outbreak; BO, before outbreak; C, clinical; E, environmental; NH, neighboring hospital; OL, outside laboratory; P, phase of outbreak.
