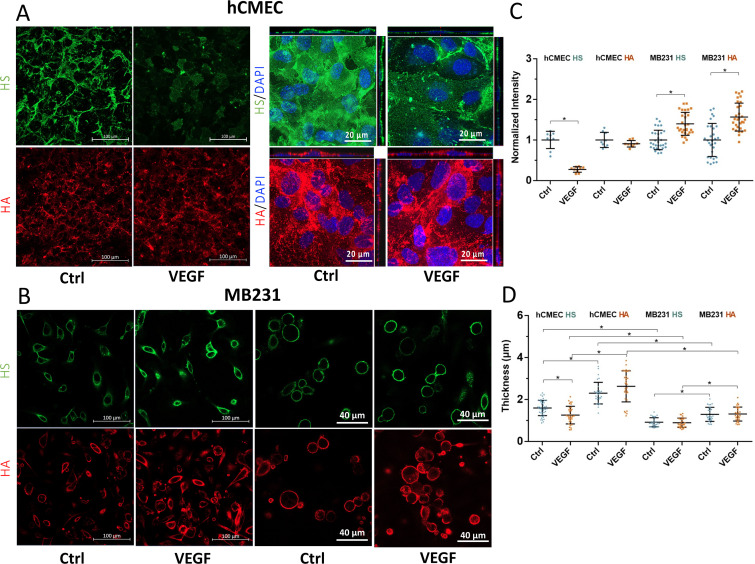
FIG. 1.
Effects of VEGF on glycocalyx of hCMEC and MB231 observed by confocal microscopy. Confocal images of (a) HS and HA of GCX on hCMEC and (b) HS and HA of GCX on MB231 under control and after VEGF treatment. The first two columns in (a) and (b) are the images collected by a 40×/NA1.3 lens. The scale bar is 100 μm. The third and fourth columns are images collected by a 63×/NA1.4 lens. (c) Comparison of HS and HA intensity under control and after VEGF treatment for hCMEC and MB231. Normalized HS and HA intensity for the control and after VEGF treatment. n = 3 samples with 3 fields in each sample (each field 320 × 320 μm) analyzed for each case for the HS and HA at hCMEC monolayer. n = 3 samples with 10 cells in each sample analyzed for each case for the HS and HA at MB231 from the images shown in the first two columns in (b). (d) Thickness of HS and HA at HCMEC and MB231 under control and after VEGF treatment. n = 3 samples with 10 cells in each sample analyzed for each case for both hCMEC and MB231 from the images shown in the third and fourth columns of (a) and (b). Plots are mean ± SD. * p < 0.05.

