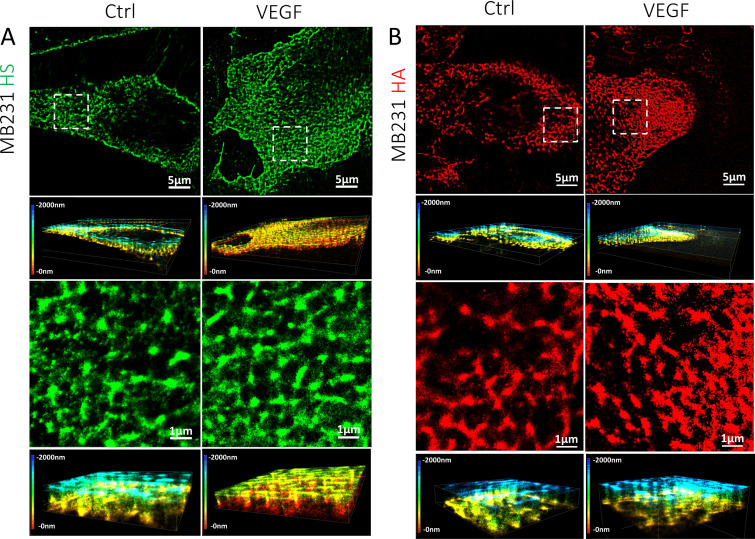
FIG. 3.
STORM images of HS and HA elements on the surface of MB231. (a) HS and (b) HA under control (left column) and after VEGF treatment (right column). The first row shows the top views (projection or 2D) of the 3D images of 40 × 40 μm (second rows) for the HS or HA on the cell surface. The third row shows the top views of the regions enclosed by the white dashed line (8 × 8 μm) in the first row, and the fourth row shows the corresponding 3D views. The color bar at the left of the 3D view represents the depth scale, from 0 to 2000 nm. 0 is located at the cell surface. The quantification method for the diameter and thickness of HS and HA elements is described in Appendix D and in Data analysis of Methods section.

