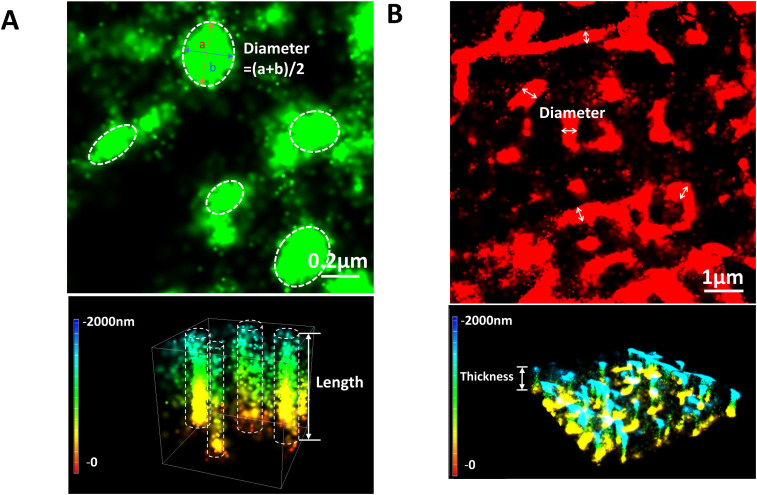
FIG. 9.
Quantification of glycocalyx ultrastructural parameters from STORM images. (a) Upper figure shows the top view of HS elements at hCMEC. The scale bar is 0.2 μm. The white dashed line circled regions indicate several HS elements. The equivalent diameter of a HS element is estimated as the average of the lengths for the long axis (a) and short axis (b). The diameter of the HS element with “a” and “b” labeled is (31 + 240 nm)/2 = 277 nm. Bottom figure shows the 3D view of HS elements. The length is measured from the cell surface to the tip using the NIS-Elements software in the N-STORM system. The color bar is the length scale, where the cell surface is at the origin (0). The white dashed line formed columns represent several HS elements. The one with the Length labeled is 1230 nm long. (b) Upper figure shows the top view of HA elements at hCMEC. The scale bar is 1 μm. The diameter of a HA element is estimated as the distance between edges of a medium sized segment in that element (indicated by the line with double arrow heads). The diameter of the HA element labeled with “diameter” is 421 nm. Bottom figure shows the 3D view of HA elements, which appear to form a network covering the cell surface. The thickness of the cover is estimated by the averaged distance between three locations from the bottom to the top for a region of 1–2 × 1–2 μm (12.5%–25% of the size of the region shown in B), which is measured by the NIS-Elements software. Thickness from 30 regions of 1–2 × 1–2 μm is measured for each case. The location with the label “thickness” is 455 nm thick. The diameters of HS and HA of MB231 as well as the corresponding thicknesses are determined by the same method for the HA of hCMEC.

