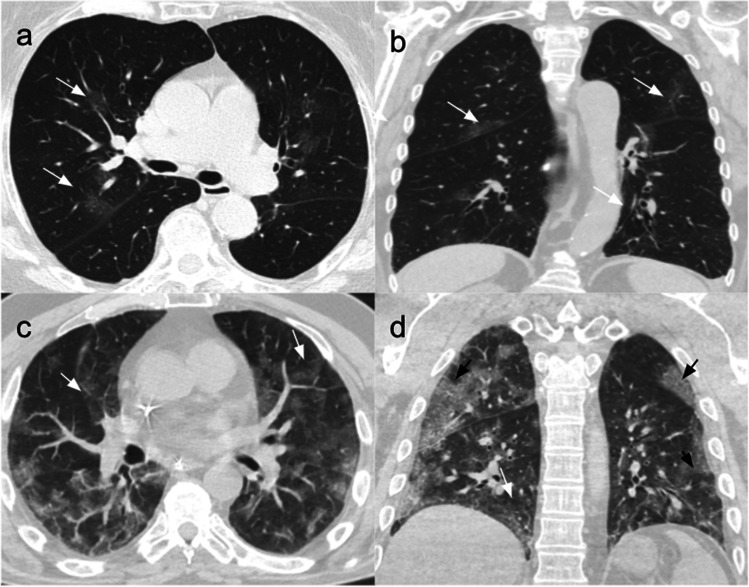
Fig. 3.
Use of semi-quantitative methods to predict the outcome of COVID-19 patients, assigning specific scores according to the percentage of involved parenchyma at chest CT scan. Patient 1 – mild disease: CT scans of an 80-year-old woman affected by COVID-19 pneumonia, hospitalized for 11 days without ICU admission and treated with low flow nasal cannula (2 ml/min) and antibiotics. (a) Non-contrast CT scan, axial plane, performed at admission showing bilateral GGOs in the centro-parenchymal areas (white arrows). (b) Non-contrast coronal plane showing bilateral GGOs in the posterior subpleural areas (white arrows). Patient 2 – severe disease: CT scans of a 68-year-old man affected by COVID-19 pneumonia and hospitalized for 25 days, with ICU admission on the fifth day due to progressive deterioration of respiratory function. He was treated with IV antibiotic and antiviral therapy and heparin. His stay in ICU was complicated with multiple urinary tract infections that led to stage two AKI, thus prolonging his total hospitalization days. (a) Non-contrast CT scan, axial plane, performed at admission showing bilateral and diffuse GGO areas in both lungs (white arrows). (b) Non-contrast coronal plane showing bilateral GGOs (white arrows) and subpleural areas with interlobular and intralobular septal thickening (black arrows)

