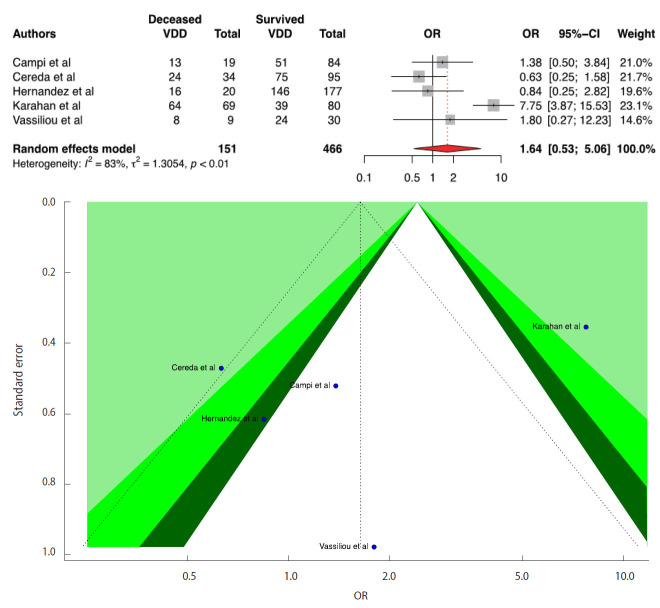
Figure 4.
Forest plot of the random-effect meta-analysis and contour-enhanced funnel plot to assess causes of funnel plot asymmetry for vitamin D and coronavirus disease 2019 (COVID-19) mortality in the meta-analysis for serum 25(OH)D levels <20 ng/mL or 50 nmol/L. For the CI, the light-green area indicates p<0.01, the green area indicates 0.01≤p<0.05, and the dark-green area indicates 0.05≤p<0.1. The p-value for the Egger test was 0.528. VDD, vitamin D deficiency; OR, odds ratio; CI, confidence interval.

