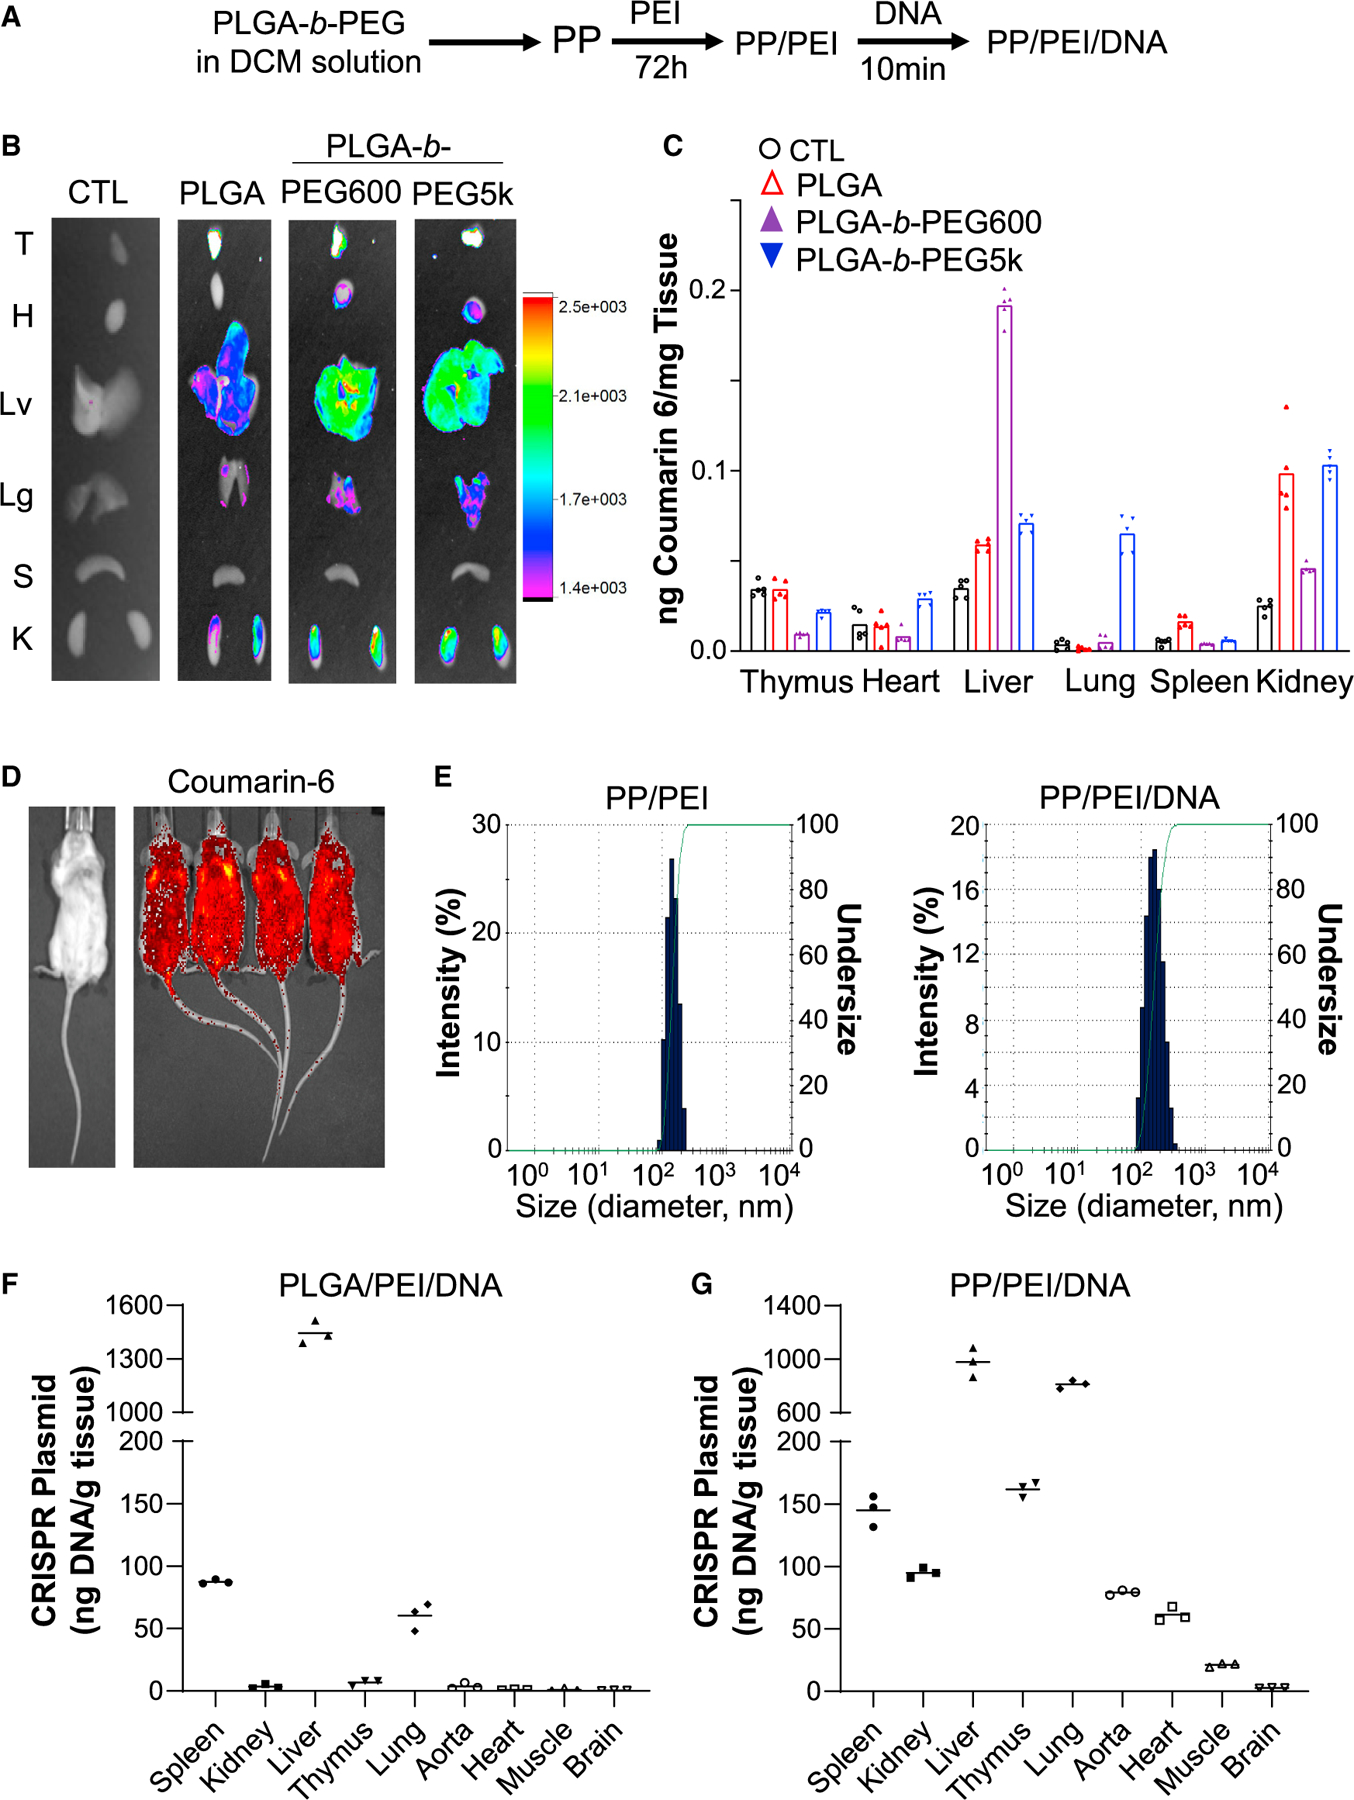
Figure 1. Characterization and biodistribution of the PLGA-based nanoparticles.

(A) Diagram showing the procedures to generate PP/PEI nanoparticle for plasmid DNA delivery.
(B) Superior biodistribution of PEG5000Da-b-PLGA (PP) nanoparticles. IVIS imaging of fluorescent dye coumarin 6-loaded nanoparticles in various organs at 8 h post-retro-orbital administration. CTL, naïve mice without nanoparticle administration. T, thymus; H, heart; Lv, liver; Lg, lung; S, spleen; K, kidney.
(C) Quantification of biodistribution by normalizing the fluorescent intensity to the tissue weight (n = 5). Bar box represents mean.
(D) Fluorescent tomography by IVIS imaging of live mice demonstrating whole body distribution of the PP nanoparticles. The image was taken 5 h after injection of coumarin 6-loaded PP nanoparticles (no plasmid DNA) via the retro-orbital venous plexus.
(E) Size distribution of PP/PEI nanoparticles and PP/PEI/DNA complex. The size distribution of the nanoparticles was characterized with a Zetasizer. The study was repeated four times with similar data.
(F and G) Quantification of CRISPR plasmid DNA in various organs after nanoparticle delivery. The CRISPR plasmid DNA (40 μg/mouse) was delivered into 3- to 4-month-old mice by PLGA/PEI (without PEG) (F) or PP/PEI (G) nanoparticles through retro-orbital injection. The amount of Cas9 cDNA carried in the plasmid DNA at 8 h post-administration was determined by quantitative PCR (QPCR) analysis, calculated using a standard curve generated from the CRISPR plasmid DNA, and normalized to the tissue weight. n = 3 (F, G). Bars represent means.
