Figure 1.

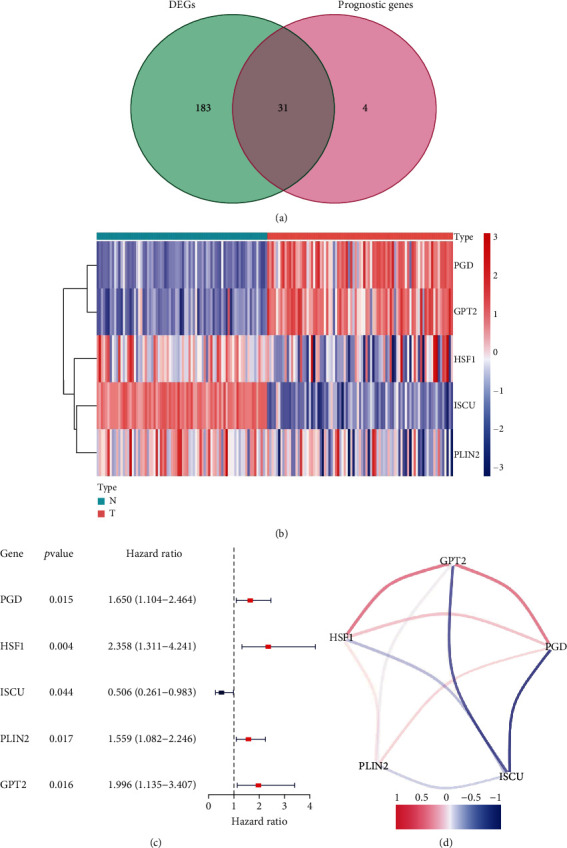
Identification of the FRGs in the TCGA and GTEx cohort. (a) Venn diagram to identify differentially expressed genes between the FRGs that were correlated with OS. (b) The two overlapping genes were all upregulated, and three genes was downregulated in tumor tissue. (c) Forest plots showing the results of the univariate Cox regression analysis between gene expression and OS in the US. (d) The correlation network of candidate genes. The correlation coefficients are represented by different colors.
