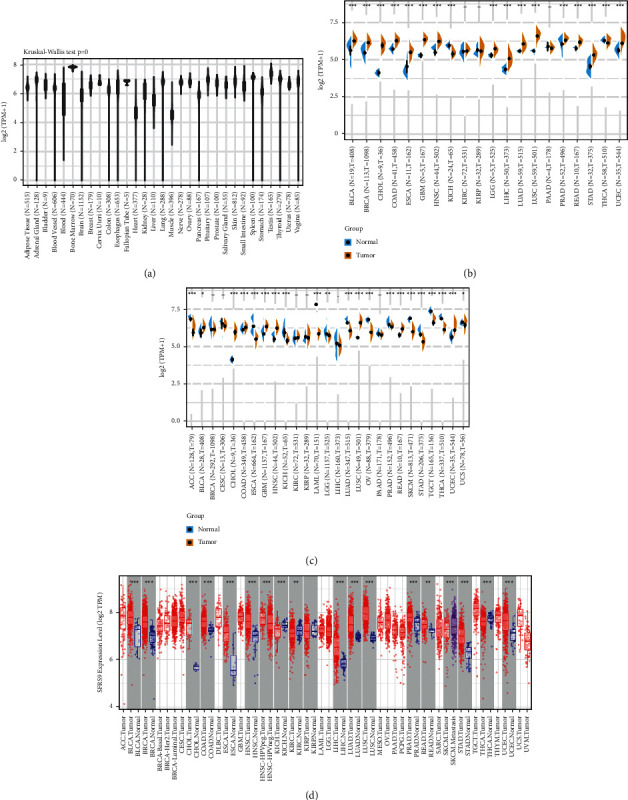
Figure 1.

The transcription levels of SRSF9 in various tissues and tumors. (a) The expression levels of SRSF9 in different normal tissues from GTEx database. (b) The expression difference of SRSF9 in tumor and adjacent normal samples in pan-cancer from TCGA database and (c) combining data from TCGA and GTEx database. (d) The expression difference of SRSF9 in tumor and normal tissues from TCGA database by TIMER. The red color represents the expression of SRSF9 in tumors, and other colors represent the normal tissue.
