
Figure 6.
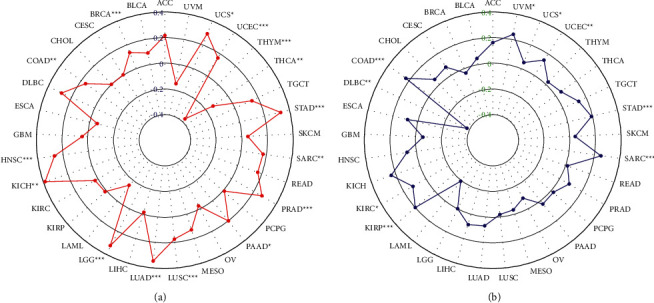
(a) Radar plot showing the correlation between SRSF9 expression and TMB in pan-cancer. The blue number represents Spearman's correlation coefficient. (b) Radar plot showing the correlation between SRSF9 expression and MSI in pan-cancer. The green number represents Spearman's correlation coefficient. ∗p < 0.05, ∗∗p < 0.01, ∗∗∗p < 0.001.