
Figure 9.
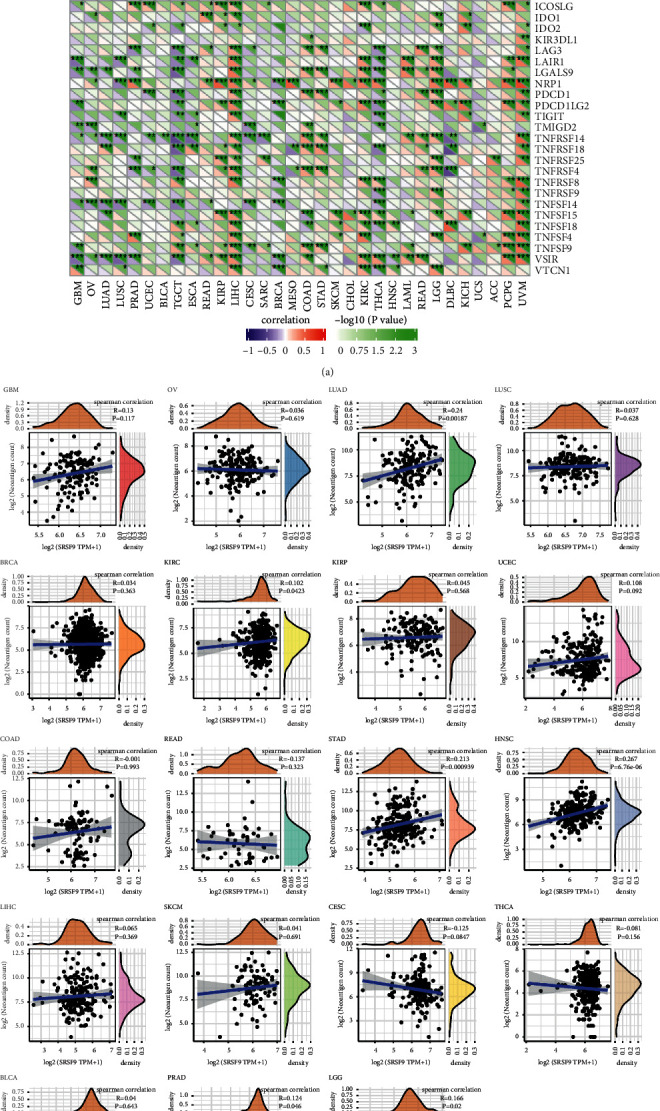
(a) The correlation between SRSF9 expression and immune checkpoint genes in pan-cancer. Each square corresponded to the correlation between SRSF9 expression and the expression of one immune checkpoint gene in a particular tumor. The upper triangle of each square represented the magnitude of the p value of the correlation test, and the lower triangle represented the magnitude of correlation coefficient (∗p < 0.05, ∗∗p < 0.01, ∗∗∗p < 0.001). (b) The correlation between SRSF9 expression and the number of neoantigens in pan-cancer.