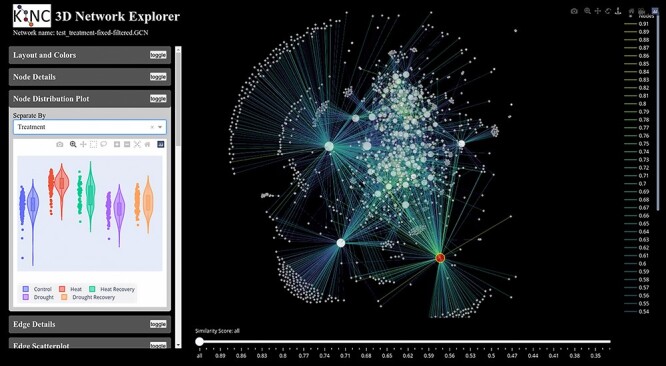
Figure 4.

KINC GCN visualization. KINC provides a web-based tool for network visualization that allows the researcher to layer and color edges by their similarity score, R2 value, P values, rank, variable categories and relationship direction (negative or positive). The left sidebar provides useful plots such as scatter plots for selected edges, violin plots of expression for selected nodes, scale-free and clustering plots for the network and functional details about nodes.
