
Figure 5.
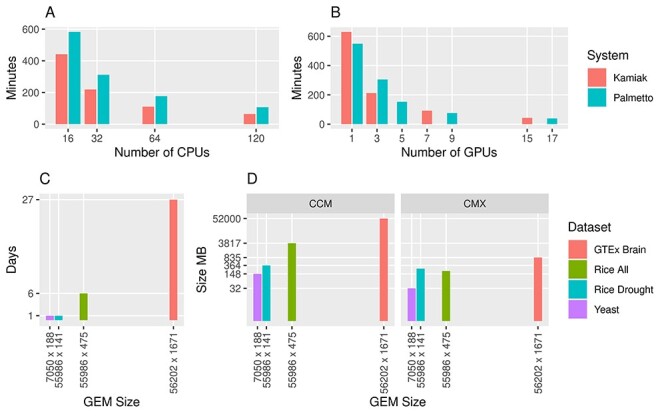
Computational performance of Steps 1–4 using KINC. Plots (A) and (B) indicate time of execution on a yeast (Saccharomyces cerevisiae) GEM containing 7050 gene transcripts and 188 samples on both CPUs and GPUs respectively. Performance measurements were measured on Clemson’s Palmetto HPC cluster and WSU’s Kamiak HPC cluster. Plot (C) indicates the time required to analyze GEMs of different dimensions on WSU’s Kamiak cluster using three GPUs. Plot (D) indicates the size in MB for the CCM file and the CMX file. KINC was instructed to only retain correlations whose absolute value was greater than or equal to 0.5. The GEM size axis in plots (C) and (D) is represented as the number of gene transcripts versus the number of samples.