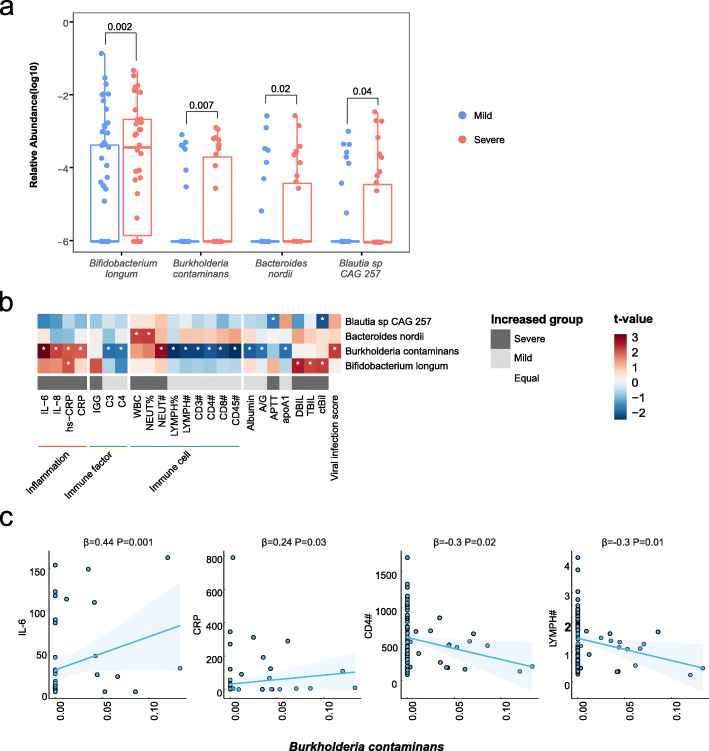
Fig. 2.
Associations of gut microbial species with COVID-19 severity and host immune response. a Relative abundances of the 4 different species in patients with severe condition or mild condition at the criteria of P < 0.05 and LDA > 2 by LEfSe. The numbers represent P-value of the Wilcoxon rank-sum test. b Associations of differential microbial species with clinical traits with adjustment for age and sex. Red bars indicate positive associations, and blue bars indicate negative associations. White asterisks indicate associations with P < 0.05. The color key indicates the association strength and direction in terms of the t-value. The gray bar shows in which group the corresponding indicator is higher. The bottom color bar shows the classifications of clinical traits. The percent sign (%) represents the percentage, and the pound sign (#) represents the count value of the corresponding immune cells. c The associations between the relative abundance of Burkholderia contaminans and circulating levels of IL-6, CRP, and counts of CD4+ T cell and total lymphocyte

