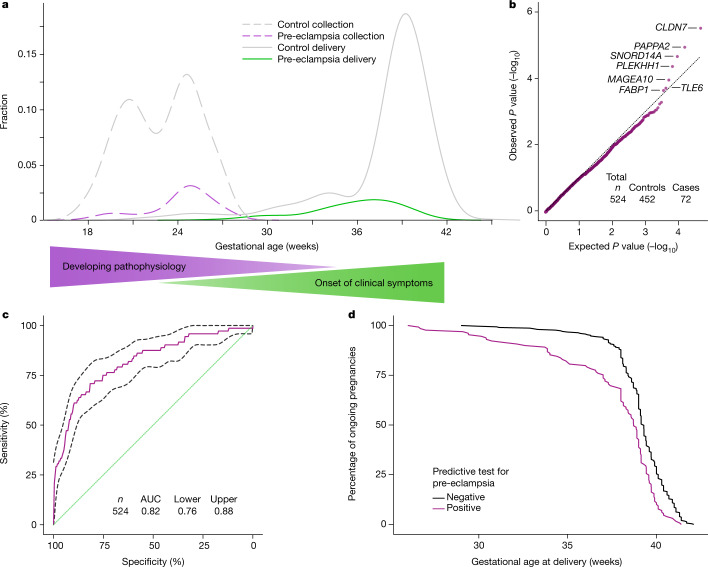
Fig. 3. Features and model performance for prediction of pre-eclampsia.
a, Sample collection time (dashed lines) and delivery time (solid lines) for women with pre-eclampsia (purple and green) and controls (grey). Gradients illustrate timelines for developing pathophysiology and onset of clinical symptoms. b, Quantile–quantile plot of ranked Spearman P values for women with pre-eclampsia (cases) versus controls. P values were calculated from Spearman correlation on cohort-corrected data for each gene. The genes used in the model are labelled. The black dotted line represents the expectation. c, Receiver operating characteristic curve (mean and 95% confidence interval) for the logistic regression model for pre-eclampsia (n = 524). d, Kaplan–Meier curves of deliveries in test-positive and test-negative populations (n = 439), excluding spontaneous preterm deliveries.

