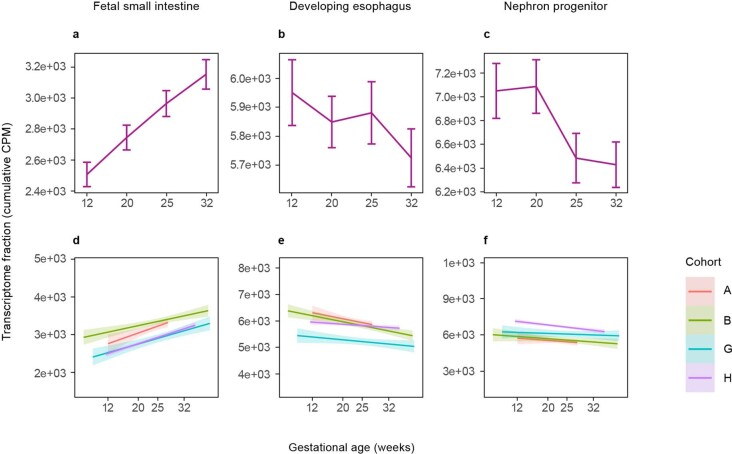
Extended Data Fig. 2. Temporal profiles of fetal gene sets from developing kidney and gastrointestinal tract.
a-c, Maternal plasma transcriptome fractions for gene sets averaged across all samples in a given collection window. Error bars correspond to the 95% confidence interval around the mean. CPM, counts per million. N=93 for each timepoint and gene set. d-f, signal across all cohorts with longitudinal data. Linear fits of transcriptome fractions for all samples across corresponding gestational ages recorded at the collection times. The band around the solid line corresponds to the 95% CI. All slopes for the gestational age coefficient are distinct from 0 at a confidence level of 0.05. Cohort is indicated by color.

